
 China Soybean
China is the largest soybean-consuming country in the world, but its self-sufficiency rate of 16% is very low. Based on the agronomic climate zonation, the soybean-growing regions of China are divided into three major regions: Northeast China, Central China and South China (Lv et al., 1981). The Northeast China has the largest soybean planting area, accounting for 65% of the national soybean area. The soybean yield in Northeast China and Central China showed an increasing trend in the last decade but stagnated in South China (Fig. 1). It is urgent to explore the possibility of reasonable area expansion and the potential of yield gain in different soybean-growing regions to increase China's soybean self-sufficiency. A detailed explanation of the methodology used to estimate yield potential and yield gaps for soybean in China, and associated data inputs, is available elsewhere (Wang et al., 2023).
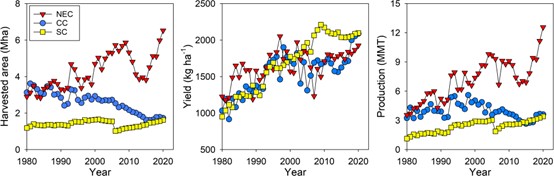
Fig. 1. Harvested area (a), yield (b) and production (c) of soybean in different regions in China. Major soybean planting regions are divided into Northeast China (NEC), Central China (CC), and South China (SC) according to the agronomic climate zonation based on a previous study (Lv et al., 1981).
Data Sources and Assumptions (following GYGA protocols)
Harvested area
The soybean harvested area map was from spatial production allocation model (SPAM) of the latest version SPAM 2010 (Yu et al. 2020; IFPRI 2019). Soybean area in Northeast China from SPAM 2010 was adjusted based on municipal data from NBSC because of the shifts of major soybean areas within Northeast China in the last decade, which could not be well depicted by SPAM 2010 with the data from 2009 to 2011. In brief, soybean area in Northeast China at the municipal level was aggregated by using the NBSC data from 2018 to 2020 and compared with the area in SPAM 2010. The ratio of changes was calculated to adjust the area in SPAM 2010 as follows:
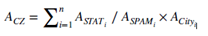
where ACZ indicates the adjusted area in a CZ; n indicates the number of sites that have a spatial intersection within a CZ; ASTAT indicates the statistical soybean area in NBSC and ASPAM indicates the gridded soybean area in SPAM 2010 of a city; ACity indicates the gridded soybean area in SPAM 2010 where city and CZ have a spatial intersection.
In northern China, most soybean is rainfed, whereas both rainfed and irrigated soybean are grown in central and southern China. We assumed irrigated soybean to account for 50 and 33% of the total soybean area in central and southern China, respectively, based on Yu et al (2020).
Weather data and reference weather stations (RWS)
Based on crop harvested area distribution and the agro-climatic zones (Grassini et al., 2015; van Bussel et al., 2015), a total of 23 RWS were selected for rainfed soybean located mainly in northeast, central and south China. Of these RWS, the 12 RWS located in central and south China were also selected for irrigated soybean. The total area of the buffer zones formed around the RWS covers 43% of total soybean area and the RWS were distributed in 13 CZs, accounting for 74% of total soybean area. The selection was slightly less than 50% due to the sparse distribution of soybean areas in South China with small area buffer zones.
Daily weather data of 836 weather stations covering all over China from 2010–2019 were provided by China Meteorological Administration (CMA 2022) including maximum temperature, minimum temperature, and precipitation. Radiation data were obtained from NASA POWER Data Access Viewer (NASA 2022). The weather data were processed to exclude outliers and fill in missing data following the GYGA protocols.
The crop model
Simulation was performed using CROPGRO-Soybean model embedded in the Decision Support System for Agrotechnology Transfer (DSSAT, v4.7), which has been used widely for soybean growth simulation and management practice improvement worldwide (Bebeley et al. 2022; da Silva et al. 2021; Guo et al. 2023; Mulazzani et al. 2022; Perondi et al. 2022). In this model, soil, plant, and soil-plant-atmosphere systems were simulated daily (Boote et al. 1998; Jones et al. 2003). Simulations for irrigated soybean in central and southern region assumed no water limitation while simulations of rainfed soybean (northern, central, and southern areas) considered the influence of water supply from in-season rainfall and stored water at sowing time.
Soil information
Soil data for model simulation were from the Global High-Resolution Soil Profile Database, including soil properties and hydraulic properties such as soil bulk density, texture, organic carbon, pH, saturated hydraulic conductivity, field capacity, and wilting point (Han et al. 2015; Komarek et al. 2018).
Soybean management practices
Management practices followed the high-yielding experiments, which were set according to local high-yielding management practices with dominant cultivars, sufficient water and fertilizer supply, and strict control of pests, diseases, and weeds by major soybean research institutes and universities in China. S
Actual yields
The data of actual soybean area and average yield were retrieved from national and municipal bureau of statistics (NBSC 2013–2020). To derive separate estimates of actual yield for irrigated and rainfed crops in the central and southern regions, we considered the fraction of irrigated and rainfed area in each region, and assumed irrigated to rainfed yield ratios of 1.3 (central) and 1.22 (south), which were derived from our revision of the literature and experimental data from the two regions. There was no need to do this for northern China as most soybean is grown under rainfed conditions in this region.
References
Bebeley JF, Kamara AY, Jibrin JM, Akinseye FM, Tofa AI, Adam AM, Kamai N, Solomon R (2022) Evaluation and application of the CROPGRO-soybean model for determining optimum sowing windows of soybean in the Nigeria savannas. Sci Rep 12:6747. https:// doi. org/ 10. 1038/ s41598- 022- 10505-4.
CMA, China Meteorological Administration. China Surface climate data daily value dataset V3.0. http:// data. cma. cn/ data/ cdcde tail/ dataC ode/ SURF_ CLI_ CHN_ MUL_ DAY_ V3.0. html. Accessed 1 Mar 2022.
da Silva EHFM, Boote KJ, Hoogenboom G, Gonçalves AO, Junior ASA, Marin FR (2021) Performance of the CSM-CROPGROsoybean in simulating soybean growth and development and the soil water balance for a tropical environment. Agric Water Manag 252:106929. https:// doi. org/ 10. 1016/j. agwat. 2021. 106929.
Grassini P, van Bussel LGJ, Van Wart J, Wolf J, Claessens L, Yang H, Boogaard H, de Groot H, van Ittersum MK, Cassman KG (2015) How good is good enough? Data requirements for reliable crop yield simulations and yield-gap analysis. Field Crop Res 177:49–63. https:// doi. org/ 10. 1016/j. fcr. 2015. 03. 004.
Han E, Ines A, Koo J (2015) Global high-resolution soil profile database for crop modeling applications. Harv Dataverse. https:// doi. org/ 10. 7910/ DVN/ 1PEEY0.
IFPRI, International Food Policy Research Institute (2019) Global spatially-disaggregated crop production statistics data for 2010 version 2.0. Harvard Dataverse, V4. 10.7910/DVN/PRFF8V.
Komarek AM, Koo J, Wood-Sichra U, You L (2018) Spatially-explicit effects of seed and fertilizer intensification for maize in Tanzania. Land Use Policy 78:158–165. https:// doi. org/ 10. 1016/j. landusepol. 2018. 06. 033.
Mulazzani RP, Gubiani PI, Zanon AJ, Drescher MS, Schenato RB, Girardello VC (2022) Impact of soil compaction on 30-year soybean yield simulated with CROPGRO-DSSAT. Agr Syst 203:103523. https:// doi. org/ 10. 1016/j. agsy. 2022. 103523.
NASA, NASA prediction of worldwide energy resources data access viewer. https:// power. larc. nasa. gov/ data- access- viewer. Accessed 1 Mar 2022.
NBSC, National bureau of statistics of the People’s Republic of China (2013-2020) China Statistical Yearbook. China Statistics Press, Beijing, China.
Perondi D, Boote K, De Souza NóiaJúnior R, Mulvaney M, Iboyi J, Fraisse C (2022) Assessment of soybean yield variability in the southeastern U.S. with the calibration of genetic coefficients from variety trials using CROPGRO-Soybean. Agron J 114:1100–1114. https:// doi. org/ 10. 1002/ agj2. 20995.
van Bussel LGJ, Grassini P, Van Wart J, Wolf J, Claessens L, Yang H, Boogaard H, de Groot H, Saito K, Cassman KG, van Ittersum MK (2015) From field to atlas: upscaling of location-specific yield gap estimates. Field Crop Res 177:98–108. https:// doi. org/ 10. 1016/j.fcr. 2015. 03. 005.
Wang Y, Ling X, Ma C, Li C, Zhang, W, Huang J, Peng S, Deng, N (2023). Can China get out of soy dilemma? A yield gap analysis of soybean in China. Agronomy for Sustainable Development, 43(4), p.47.
Yu Q, You L, Wood-Sichra U, Ru Y, Joglekar AKB, Fritz S, Xiong W, Lu M, Wu W, Yang P (2020) A cultivated planet in 2010 – part 2: the global gridded agricultural-production maps. Earth Syst Sci Data 12(4):3545–3572. https:// doi. org/ 10. 5194/ essd- 12- 3545- 2020.

Get access to the Atlas for advanced users
Download GYGA results
| Please read the license information in case you are interested in using the data from the Global Yield Gap Atlas. | |
| read more>> |
Country agronomists

Nanyan Deng

Yucheng Wang