
 Uruguay
Description of cropping systems,
Crop production area in Uruguay has increased from 845,000 hectares in 2005 up to almost 2 million ha in 2013 (DIEA, 2014). This great expansion over the last years was observed for most crops but especially for soybean. Most recent information of sown area, total production, and grain yield for the most important crops in Uruguay is presented in Table 1.
Table 1. Average crop land area (thousands ha), total production (million tons) and grain yield (kg/ha) in Uruguay (2009-2013) for most important rainfed crops and rice. Source: MGAP DIEA 2014.
| Winter Crops | Summer Crops | |||||
| Wheat | Barley | Soybean | Rice | Maize | Sorghum | |
| Planted Area (x1000 ha) | 495 | 111 | 847 | 175 | 102 | 54 |
| Total Production (k tonnes) | 1,5 | 0,3 | 1,9 | 1,4 | 0,5 | 0,2 |
| Yield (kg/ha) | 2997 | 2892 | 2139 | 7847 | 4416 | 4219 |
Uruguay has plenty water resources; hence, there is large room for further irrigation development. Total irrigated area in the country is 227.577 ha, accounting for 15% of total crop area (FAO Aquastat, 2015). All rice crops in Uruguay are irrigated while soybean, maize and sorghum are mostly rainfed. (Table 2).
Table 2. Irrigated crop areas for the most important summer crops in Uruguay Source: FAO, Aquastat 2015.
| Soybean | Rice | Maize | Sorghum | |
| Irrigated Area (ha) | 4730 (2009) | 181.000 (2011) | 13.700 (2010) | 2200 (2009) |
| Percentage of Total area | 0.6% | 100% | 17% | 6% |
Some of the remarkable features of agriculture in Uruguay are: (i) widespread use of no tillage, (ii) about 35 % of soybean is planted as a second crop after either wheat or barley (double cropping), (iii) almost 100 % of soybean is GMO, (iv) continuous cropping systems prevail but rice systems includes crop sequences in rotation with perennial pastures, and (v) total crop area is planted with certified seeds.
Climate
Uruguay is located between 30° and 35° S and has a subtropical to temperate climate, with an average annual rainfall ranging from 1200 mm (Southwest) to 1600 mm (Northeast). Average temperature is 17.7 °C, ranging from 19.8 °C (North) to 16.6°C (South). Minimum and maximum average temperatures are 12.9 °C and 22.6 °C, respectively, with highest and lowest temperatures in January and July, respectively (Castaño et al. 2011). Detailed information about Uruguayan climate can be found on INIA GRAS Unit website: www.inia.uy/investigación-e-innovación/unidades/GRAS/Clima.
Soils
Dominant agricultural soils of Uruguay correspond to Mollisols and Vertisols orders (the latter are most common ones). There are also a smaller proportion of agricultural soil that belong to Alfisols, Ultisol, Inceptisols, Histosols and Entisols orders (Duran, 1991, Duran et al., 2005, Duran and Garcia., 2007). Rice crops are grown mainly on medium textured soils with poor drainage and low slope (Planosols in the Center-East) and also in higher fertility soils like Mollisols and Vertisols in the North with a higher slope. Detailed information about Uruguayan soils can be found online in: http://www.cebra.com.uy/renare/mapa/cartas-de-suelo
Data Sources and Assumptions for rice yield gap assessment
GYGA methodology and protocols were followed in order to select data sources, define the agro-climatic zones in Uruguay, simulate crop yield, and estimate yield gaps at specific locations (Van Wart et al., 2013a, 2013b; Van Bussel et al., 2015; Grassini et al., 2015).
Harvested area
Geo-referenced rice harvested area was retrieved from the MGAP Census 2011, Ministry of Livestock, Agriculture and Fisheries (http://www.mgap.gub.uy/). Uruguay is divided in 637 numeric areas (NA). (Figure 1).

Figure 1. Rice harvested area distribution in Uruguay. Source: MGAP, Census 2011.
Weather data and reference weather stations (RWS)
Rice in Uruguay is cultivated in 7 of the 13 climate zones (CZ) found in Uruguay, (Figure 2 A). Seven reference weather stations (RWS) were selected within four climate zones; these RWS cover 90% of the total rice area in the country (Figure 2 B, Table 3).
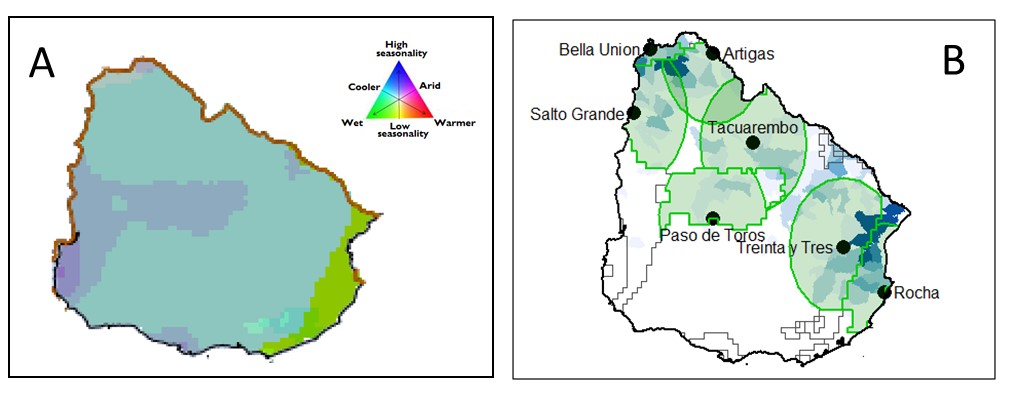
Figure 2. A). GYGA Climate Zones (Cz). B). Selected reference weather stations and associated buffer zones.
Long-term daily weather data (20+ years) were retrieved from different sources (Table 3). Data for 3 weather stations were retrieved from INIA: Salto, Tacuarembó and Treinta y Tres. www.inia.uy/investigación-e-innovación/unidades/GRAS/Clima/Banco-datos-agroclimatico. All weather variables required for Oryza(v3) model (daily radiation, Tmin, Tmax, humidity, precipitation, and wind speed) were available. Data for 2 weather stations were retrieved from INUMET: Paso de los Toros and Artigas (http://www.meteorologia.com.uy). Weather data for Bella Unión was provided by ALUR (Alcoholes del Uruguay) and by a private company (Agridiamond) for Rocha. Radiation was estimated from registered sunshine hours at the latter location. Quality control and filling/correction of the weather data was performed based on NASA-POWER (http://power.larc.nasa.gov/) for INUMET, ALUR and Agridiamond data sets in order to have complete weather records available for all RWSs for the 1997-2014 time interval.
Table 3. Reference weather stations (RWS), source of data and rice harvested area within buffer zone (BZ) for each climate zone.
| RWS | Source | Area in BZ (kha) | Total (%) | Climate Zone |
| Treinta y Tres | INIA | 86,9 | 48 | 6702 |
| Salto Grande | INIA | 22,8 | 13 | 6702 |
| Rocha | Agridiamond | 20,1 | 11 | 6701 |
| Tacuarembó | INIA | 18,9 | 10 | 6702 |
| Bella Unión | ALUR | 10,1 | 6 | 7702 |
| Artigas | INUMET | 3,5 | 2 | 6702 |
| Paso de los Toros | INUMET | 1,8 | 1 | 6602 |
| TOTAL | 164 | 90 |
Actual yields
Average rice yield in Uruguay has increased at a rate of 154 kg/ha/year over the past 15 years, reaching 8064 kg/ha in the 2013/14 season (Figure 3). This is explained mainly by the adoption of high yielding varieties, improved soil management practices, higher percentage of the area planted during the optimum planting date window, early weed control, irrigation, disease control and efficient use of inputs (Blanco et al., 2010).

Figure 3. Rice yield by year in Uruguay for the last 15 years (13% moisture content). Source MGAP-DIEA-Anual Estadístico 2014.
Actual yields for this study were retrieved from yield data (at 14% moisture content) provided by farmers to the rice industry database. All numeric areas (NA) within each buffer zone were selected using ArcGIS and a weighted mean (on an area basis) of actual yields across all the NA was calculated for each buffer zone for the last five years. Only the last 5 years (2010-2014) were considered for calculating actual yield to avoid the effect of the steep technological trend (Figure 3).
Crop system and management information for crop simulations
The rice crop season extends from late September-October to April, being the optimal sowing date in early October when most of the rice area (almost 70%) is planted.
Rice develops as an upland crop until is flooded 15-35 days after emergence and all rice systems in Uruguay are irrigated. Rice production in Uruguay is highly mechanized, most of the crops are drill seeded (90%), and tillage operations, land leveling, sowing and post emergence weed control are done in dry (non- flooded) soil.
The typical rotation system is 2-year rice followed by three years of perennial pastures, which are used for beef cattle grazing (Battello et al., 2009). A high percentage of total rice area (56%) is planted on fields that were not planted with rice in previous seasons (first year rice after pasture) and only 7% of the rice area is planted after three or more rice crops in the same field (rice after rice) (Table 4) (MGAP-DIEA-Anual Estadístico, 2010, 2012 and 2014).
Table 4. Rice Cropping Systems in Uruguay average of three seasons 2009/10, 2011/12, 2013/14. Source: MGAP-DIEA- Anual Estadístico 2010-2014.
| Cropping System | TOTAL | ||
| Hectares (x 1000 ha) | (%) | ||
| Rice (first year) after Pasture or winter Crop | 97,6 | 56 | |
| New land for agriculture | 5,4 | 3 | |
| Return after pasture | 75.9 | 44 | |
| Return from other annual crops | 16,3 | 9 | |
|
| |||
| Rice After Rice | 72,6 | 41 | |
| Rice Second Year | 60,5 | 34 | |
| Rice Third or more years | 12,1 | 7 | |
Management practices for each RWS buffer zone were retrieved from the rice industry database, which was verified using published information and expert opinion from local agronomists. Requested information include: dominant crop rotations, average planting date, dominant cultivar, and plant population density (Table 5).
Table 5. Cropping systems to be simulated by weather station (WS).
| WS name | Region | Weight | Cultivar | Sowing Date | Plant density |
| Treinta y Tres | Este | 61 | El Paso 144 | 20/10/2015 | 260 |
| Rocha | Este | 61 | El Paso 144 | 20/10/2015 | 260 |
| Paso de los Toros | Centro | 40 | INIA Olimar | 20/10/2015 | 260 |
| Tacuarembo | Centro | 40 | INIA Olimar | 20/10/2015 | 260 |
| Artigas | Norte | 45 | INIA Olimar | 15/10/2015 | 260 |
| Bella Unión | Norte | 45 | INIA Olimar | 15/10/2015 | 260 |
| Salto Grande | Norte | 45 | INIA Olimar | 20/10/2015 | 260 |
Rice production has been based on locally developed long-grain varieties. The dominant cultivars are El Paso 144, INIA Olimar and INIA Tacuarí. The first two are Indica ecotype and the last one is tropical japonica. The main cultivars used for simulations were: El Paso 144 for the East Region (Rocha and Treinta y Tres) and INIA Olimar for North and Central Regions (Bella Unión, Artigas, Salto Grande, Tacuarembó, Paso de los Toros). A high percentage (95%) of the rice area in Uruguay is planted with certified seed.
Simulations for each region were performed using ORYZA V3 (Bouman et al., 2001). Phenology calibration was done with information collected over 10 years for the dominant rice varieties (INASE-INIA, 2005-2014). Average developmental rates were calibrated using the "DRATESv2" program included with Oryza(v3). Comparison of observed and simulated flowering and maturity dates indicated a very good agreement (Figure 4).
Figure 4. Comparison between observed and simulated flowering and maturity dates for early (PDL1) and late planting dates (PDL2) at Paso de la Laguna (Treinta y Tres).
Evaluation of simulated yield potential by the crop model was performed by comparing the simulated yield potential by Oryza V3 with measured yields, using an independent dataset from high yielding experiments (Perez de Vida et al., 2011, 2014 and 2015, Deambrosi et al., 2015), and from national cultivars evaluation trial in Tacuarembó (INASE-INIA 2005). Only experiments located within a GYGA RWS buffer zone were used (Figure 5 B). Weather data from the RWS in the same buffer zone were used for the simulations. Most (67%) of the observed actual yields Ya were within 85-100% of the simulated yield potential Yp (Figure 5 A), which is consistent with our expectations. This slight overestimation is likely due to the inability to eliminate all yield limiting factors in most experiments. For example, varieties El Paso144 and INIA Olimar are not disease resistant so there could be a loss in rice yield due to Pyricularia spp. In addition, many of the experiments were conducted in farmers' fields with little control of biotic factors and not explicitly managed to reach yield potential.

Data Sources and Assumptions for Maize, Wheat and Soybean yield gap assessments
Harvested area and actual yields
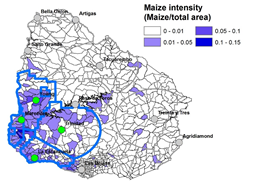
Data on crop harvested area at subnational level ("enumeration unit", equivalent to county) for each crop was retrieved from the Censo Agrícola 2011 (DIEA, Ministerio de Ganadería, Agricultura y Pesca de la República Oriental del Uruguay). Average yields from the most recent 6 cropping seasons (2009-2010 to 2014-2015; total of 6 harvest years) were retrieved from FUCREA and DIEA (http://www.fucrea.org/).
Weather data and reference weather stations
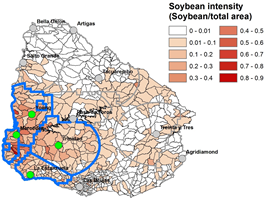
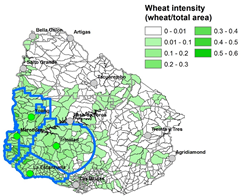
Two networks of meteorological stations were available: INIA (Instituto Nacional de Investigación Agropecuaria; http://www.inia.uy/gras/Clima/Banco-datos-agroclimatico) and INUMET (Instituto Uruguayo de Meteorología; http://www.meteorologia.com.uy/). Daily weather data were available for the last 15 years and include daily maximum and minimum temperature and precipitation. Based on crop harvested area distribution and the agro-climatic zones defined for Uruguay (Van Wart et al., 2013a), a total of 4 (maize) and 5 (soybean and wheat) reference weather stations (RWS) were selected. RWS buffer zones accounted for 70, 71, and 70% of total harvested for maize, soybean and wheat, while the agro-climatic zones where these locations were located accounted for 97, 97, and 97% of national area for these crops.
Quality control and filling/correction of the weather data was performed following van Wart et al. (2013b). Number of corrections/filled data was always lower than 3% for all variables. NASA-POWER (http://power.larc.nasa.gov/) was used as source of incident solar radiation data at all RWS because daily measured solar radiation was lacking at most of the RWS. Comparison between NASA-POWER and actual solar radiation measurements for a subset of locations and years indicated high degree of agreement between both data sources (RMSE: 2.7 MJ m-2 d-1; R2=0.91) (Rizzo, unpublished data). Hence, complete weather records (daily solar radiation, Tmax, Tmin, and precipitation) were available for the 2000-2015 interval for which yield potential (Yp) and water-limited yield potential (i.e. rainfed, Yw) were simulated. The first simulated crop season was 2000-2001 (harvested year 2001) and the last one 2014-2015 (harvested year 2015), hence, a total of 15 cropping seasons were simulated.
Soil data
The dominants soil (accounting for >50% of the crop area within each RWS) were identified based on CONEAT soil data (http://www.cebra.com.uy/renare/informacion-geografica/mapas-e-informacion/carta-grupo-suelos-coneat/) provided by the Natural Resources Division of Ministerio de Ganaderia Agricultura y Pesca. Briefly, a two-step procedure was followed: first, national soil maps (1:40.000) were used to calculate the area of all soil series within the buffer, and (ii) 1-4 dominant soil series were selected for crop simulations based on the relative area within the buffer and land use suitability. Soil inputs required for crop simulations, such as soil depth, runoff curve number, lower and upper limits for water retention, etc., were derived from soil profile descriptions available from the Compendio de Suelos del Uruguay (http://www.cebra.com.uy/renare/biblioteca-digital/). Rooting depth was set at 1.4 m but no accurate data on rooting depth was available for Uruguayan soils. Sensitivity analysis indicates that uncertainty in this parameter can affect average simulated Yw from 0 to 98% across RWS and crops.
Crop system and management information for crop simulations
Management practices for each RWS buffer zone were retrieved from farmer data available in the FUCREA database. Retrieved information includes: average sowing dates, dominant cultivar name and maturity, and actual and optimal plant population density. The provided data were subsequently corroborated by national experts. Dominant crop rotations and proportion of each of them to the total harvested area was calculated based on cropping sequences reported in the Planes de Uso de Suelos (Information provided by RENARE Ministerio de Ganadería Agricultura y Pesca).
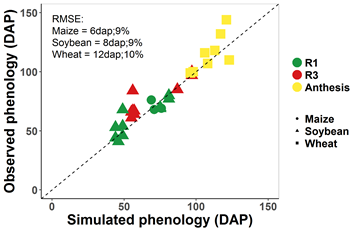
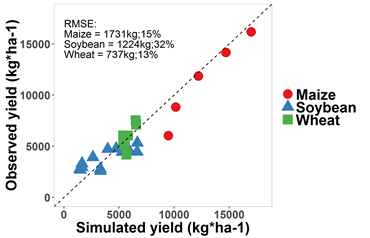
Simulations of widespread varieties for each region were performed using CERES-Maize, CERES-wheat and CROPGRO soybean model embedded in DSSAT v 4.6 (Jones et al., 2003). Genetic coefficients were previously derived and validated by Monzon et al. (2007, 2012) and Aramburu et al.(2015) based on data from well-managed rainfed and irrigated experiments in Argentina. Models were evaluated for Uruguay using data from well-managed crops grown in La Estanzuela during 2014-2015.
In order to account for differences in initial soil water at planting time among years, the entire crop sequence was simulated, assuming 50% of plant available soil water in the first year of the time series and a maize residue of 5 Mg/ha, following Aramburu et al. (2015). The simulated crop rotations were: 2-y cover crop-early soybean-wheat-late soybean, 1-y cover crop-early soybean, 3-y cover crop-early soybean-wheat-maize-fallow-early soybean (except for Treinta y Tres). Simulation runs were initialized in different years in order to have the complete set of simulated yields for the three crops in all years. Separate simulations were performed for potential (Yp) and water-limited conditions (Yw). Simulations assumed no limitations to crop growth by nutrients and no incidence of biotic stresses.
For each crop-RWS combination, each crop rotation x soil type combination was simulated, and then weighted by their relative proportion to retrieve an average Yw at the level of the RWS buffer zone. For soybean, separate averages were calculated for full-season soybean and late-soybean within the double annual cropping system (wheat/soybean). Reported Yw and Yp in the Atlas are long-term (15-year) averages. Yield gap (Yg) was calculated as the difference between long-term average Yw or Yp and average (2010-2015) actual farmers' yields.
We would like to thank all local agronomists for providing valuable information that allowed us to complete this work: Raúl Uraga, Muzzio Marella and all the technical team from SAMAN, Daniel Gonnet and Fernando Castera from CASARONE, Gonzalo Rovira and Mauricio Martínez from COOPAR, and -Humberto Tommasino and Alfredo Hernandez from Ministry of Agriculture, Livestock and Fisheries, MGAP
We also thank agronomists Adrian Cal (INIA GRAS unit), Fernando Hackembruch (ALUR Unidad Agrícola de Alcoholes del Uruguay SA) and Walter Bica Saravia (Agridiamond SA), for providing weather information.
We thank Juan Manuel Soares de Lima and the rice team scientist-agronomists from the National Research Institute (INIA) Pedro Blanco, Enrique Deambrosi, Claudia Marchesi, Ramón Mendez, Fernando Perez de Vida for valuable comments, information and sharing data of high yielding experiments for yield validation and also for phenology calibration.
References:
Aramburu Merlos, F., Monzon J.P., Mercau J.L., Taboada M., Andradea F.H., Hall A.J., Jobbagy E., Cassman K.G., Grassini P., 2015. Potential for crop production increase in Argentina through closure of existing yield gaps. Field Crops Res. 184, 145-154.
Battello, C., Uraga, R., Gonnet, D., Hill, M., Roel, A., & Martínez, I. M. (2009). Guía de buenas prácticas en el cultivo de arroz en Uruguay. Asociación Cultivadores de Arroz (ACA), GMA (Gremial de Molinos Arroceros); Universidad de la República (UDELAR) / Facultad de Agronomía; INIA (Instituto Nacional de Investigación Agropecuaria); LATU (Laboratorio Tecnológico del Uruguay). 32p.
Blanco, P., Roel, A., Deambrosi, E., Bonilla, C., Cantou, M., 2010. Closing the yield gap in rice production in Uruguay: impact of technological changes. In: International Rice Research Conference (28º, 2010, Hanoi, Vietnam). CGIAR, IRRI, Session: OP02, Closing the yield gap.
Bouman, B.A.M., Kropff, M.J., Tuong, T.P., Wopereis, M.C.S., Ten Berge, H.F.M., & Van Laar, H.H. 2001. ORYZA2000: modeling lowland rice. International Rice Research Institute, Los Baños, Philippines, and Wageningen University and Research Centre, Wageningen, Netherlands, 235 pp.
Castaño, J., Giménez, A., Ceroni, M., Furest, J., Aunchayna, R., Bidegain, M. 2011. Caracterización agroclimática del Uruguay 1980-2009 Montevideo (UY): INIA Serie Técnica; 193, 34 p.
www.inia.uy/Documentos/Privados/GRAS/Caracterizacion-agroclimatica/carac-agro-2010.pdf
Deambrosi, E., Zorrilla de San Martín, G., Lauz, M. 2015. Rompiendo el techo de rendimiento del cultivo de arroz. (INIA, GMA-COOPAR, ACA). ln: Resultados experimentales 2014-2015. Treinta y Tres: (INIA Serie Actividades de Difusión; 748), Cap. 2, p. 39-42.
Durán, A., A. Califra, J. H. Molfino, and W. Lynn. 2005. Keys to Soil Taxonomy for Uruguay. United States Department of Agriculture, Natural Resources Conservation Service. 77 pp.
| Durán, A. 1991. Los suelos del Uruguay 2a. ed. Montevideo (Uruguay): Hemisferio Sur,.398 p |
Durán, A., García Préchac, F. 2007. Suelos del Uruguay: origen, clasificación, manejo y conservación; volumen I. Montevideo: Hemisferio Sur,. 333 p.
FAO, AQUASTAT Uruguay 2015. http://www.fao.org/nr/water/aquastat/countries_regions/ury/indexesp.stm
Grassini, P., Van Bussel, L.G.J.,, P., Van Mart, J., Wolf, J., Claessens, L., Yang, H., Boogaard, H., De Groot, H., Van Ittersum, M.K. and Cassman, K.G. 2015. How good is good enough? Data requirements for reliable crop yield simulations and yield gap analysis. Field Crops Research. 177, 49-63
INIA. GRAS Unit. www.inia.uy/investigación-e-innovación/unidades/GRAS/Clima/Caracterización-agroclimática . Weather information.
INASE-INIA. www.inia.org.uy/convenio_inase_inia/resultados/index_00.htm). Resultados de la Red Nacional de Evaluación de Cultivares.
Jones, J.W., Hoogenboom, G., Porter, C.H., Boote, K.J., Batchelor, W.D., Hunt, L.A., Wilkens, P.W., Singh, U., Gijsman, A.J., Ritchie, J.T., 2003. The DSSAT Cropping System Model. Eur. J. Agron. 18, 235–265.
MGAP. DIEA. Anual Estadístico. 2000-2014. www.mgap.gub.uy/portal/page.aspx?2,diea,diea-anuario-2014
MGAP. DIEA. Censo 2011. www.mgap.gub.uy/portal/page.aspx?2,diea,diea-censo-2011
Monzon, J.P., Sadras, V.O., Abbate, P.A., Caviglia, O.P., 2007. Modelling management strategies for wheat-soybean cropping systems in the Southern Pampas. Field Crops Res. 101, 44-52.
Monzon, J.P., Sadras, V.O., Andrade, F.H., 2012. Modelled yield and water use efficiency of maize in response to crop management and Southern Oscillation Index in a soil-climate transect in Argentina. Field Crops Res. 130, 8-18.
Oryza V3. IRRI. https://sites.google.com/a/irri.org/oryza2000/about-oryza-version-3
Perez, F., Hernàndez, G., Moreira, G., Lucas, T. 2011. Construcción del rendimiento en cultivares (variedades e híbridos) de alto potencial según densidad de siembra y fertilización nitrogenada. ln: INIA Treinta y Tres. Arroz : Resultados experimentales 2010-2011. Treinta y Tres (Uruguay): (INIA Serie Actividades de Difusión; 651) Cap. 7 p. 15-22.
Pérez De Vida, F., Carracelas, G. 2014. Evaluación de cultivares promisorios en ensayos de fajas. En: Arroz-Soja:Resultados Experimentales 2013-2014. Treinta y Tres (UY): INIA Treinta y Tres. (INIA Serie Actividades de Difusión; 735) Cap. 6. p. 3-5
Pérez De Vida, F., Carracelas, G.; Blanco, P.H., Vargas, J. 2015. Evaluación de cultivares promisorios en ensayos de fajas. En: Arroz-Soja:Resultados Experimentales 2014-2015. Treinta y Tres (UY): INIA Treinta y Tres. (INIA Serie Actividades de Difusión; 751) Cap. 3, p. 1-3.
Riccetto, S., Zorrilla, G. 2015. Resumen de la zafra 2014-15, Base de datos empresas arroceras, Grupo de trabajo Arroz. http://www.inia.uy/Paginas/Informes-de-Zafras.aspx
Van Bussel, L.G.J., Grassini, P., Van Mart, J., Wolf, J., Claessens, L., Yang, H., Boogaard, H., De Groot, H., Saito, K., Cassman, K.G. and Van Ittersum, M.K. 2015. From fields to atlas: Upscaling of location specific yield gap estimates. Field Crops Research. 177, 98-108.
Van Wart, J., Van Bussel, L.G.J., Wolf J, Licker, R., Grassini, P., Nelson, A., Boogaard, H., Gerber, J., Mueller N.D., Claessens L., Van Ittersum M.K., Cassman K.G. 2013a. Use of agro-climatic zones to upscale simulated crop yield potential. Field Crops Research. 143, 44-55
Van Wart, J., Kersebaum, C.K., Peng, S., Milner, M., Cassman, K.G. 2013b. Estimating crop yield potential at regional to national scales. Field Crops Research. 143, 34-43

Get access to the Atlas for advanced users
Download GYGA results
| Please read the license information in case you are interested in using the data from the Global Yield Gap Atlas. | |
| read more>> |
Country agronomists
Rice team:
|
Gonzalo Carracelas |
|
Gonzalo Zorrilla Instituto Nacional de Investigación Agropecuária (INIA)
|


Maize, wheat and soybean team:
|
Oswaldo Ernst |
|
Gonzalo Rizzo
|

