
 Georgia: Material and Methods
Description of climate
With 37 climate zones in total, Georgia has a large climate variability due to its geographic location near to Caucasus Mountains. Air masses arrive in Georgia either from the west or the east due to the natural barrier caused by the Caucasus Mountains in the north of the country, coming from the west, air mass warms up and increases its humidity when passing over the black sea before getting in the western of the country which causes drop temperature and heavy rain, 1400 mm annually. On the other hand, when air mass comes from the east, they are relatively cold and dry air masses from the North Polar which provide 10-15% of the annual precipitation (500 mm) in the east of Georgia (Bolashvili et al., 2018).
Wheat area
Since a geospatial database to retrieve the distribution of the wheat area in a high spatial resolution was unavailable for the Republic of Georgia, we identified the distribution of the wheat area using satellite information from Moderate Resolution Imaging Spectroradiometer (MODIS) 250 m normalized difference vegetation index (NDVI) (https://ladsweb.modaps.eosdis.nasa.gov/search/) and ESA WorldCover 10 m 2021 (https://esa-worldcover.org) using a methodology similar to that proposed by Wardlow et al. (2007) and Verbessert et al. (2010). Here, wheat area was delineated by filtering the zones where four independent criteria occurred: (i) greenness increased during fall (i.e. increases in NDVI between November and early December) and (ii) during early spring (i.e., NDVI increased from March to May), (iii) NDVI was greater than 0.7 in early May, and (iv) NDVI decreased during the summer (reflecting the maturation/senescence of the wheat crop). Areas meeting all criteria were masked with the cropland area derived from ESA WorldCover as assigned to be wheat area in the country. The total area of wheat under rainfed conditions was 51,985 ha distributed in the regions of Kakheti, Shida Kartli, and Kvemo Kartli located in the central and eastern areas of the country, the winter wheat area in 2022 reported by GEOSTAT was 50,600 hectares (https://agriculture.geostat.ge/vegetation).
Climate zones and reference weather stations.
Eight climate zones (CZ) represented the majority of the wheat area in Georgia, the selected CZ covered 39,210 ha, representing 75% of the total wheat area in the country. Within these eight CZs, we identified reference weather stations to obtain meteorological data (minimum and maximum daily temperatures, solar radiation, and precipitation) from, encompassing the period between 2000 to 2022. This period was selected to perform the simulations of crop yield potential in the region given that a minimum of 15 consecutive years are needed for robust estimates of a crop’s yield potential in regions with high climatic variability (Van Wart et al., 2013). The range of each RWS should be considered in such way that it has the same climate conditions as possible (van Bussel et al., 2015), thus buffers (a radius of 100 km centered on the meteorological station and masked by the boundaries of its CZ) were created. We used the National Environmental Agency (NEA) of Georgia (https://nea.gov.ge) as the primary source for weather data. In cases of missing weather data, or buffers without RWS, we used weather data derived from NASA-POWER (https://power.larc.nasa.gov/) as daily weather data source. In the absence of recorded solar radiation by NEA and the poor agreement between solar radiation from ground observations and NASA-POWER data, since this is more prevalent in heterogeneous topography such as that in the Republic of Georgia (Wart et al., 2015), we used the Hargreaves method (1982) for calculation of solar radiation. For the CZs where observed weather data (OWD) was unavailable for the period between 2000 and 2022 or with missing days during that timeframe, we tested the agreement between data reported by RWS and the NASA-POWER database according to the approach proposed by Van Wart et al. (2015) and corrected the data accordingly (Figure 1). Here, we used two procedures: (i) To fill missing days, we used at least 3 consecutive years of measured daily air temperatures within the RWS to propagate daily maximum and minimum temperatures from NASA-POWER using the equation from the linear regression of NASA-POWER data as the independent variable (x) and observed data as the dependent variable (y) to generate the propagated data as (![]() ). (ii) When observed data was unavailable for a climate zone, we used crude data from NASA-POWER (V. Wart et al., 2013a). Correlation and agreement between the data sets were evaluated using the coefficient of determination r2 > 0.8, root mean square error RMSE < 30% of the OWD mean, slope 0.8 < m < 1.2, and intercept b < 2% of the observed weather data mean (V. Wart et al., 2015).
). (ii) When observed data was unavailable for a climate zone, we used crude data from NASA-POWER (V. Wart et al., 2013a). Correlation and agreement between the data sets were evaluated using the coefficient of determination r2 > 0.8, root mean square error RMSE < 30% of the OWD mean, slope 0.8 < m < 1.2, and intercept b < 2% of the observed weather data mean (V. Wart et al., 2015).
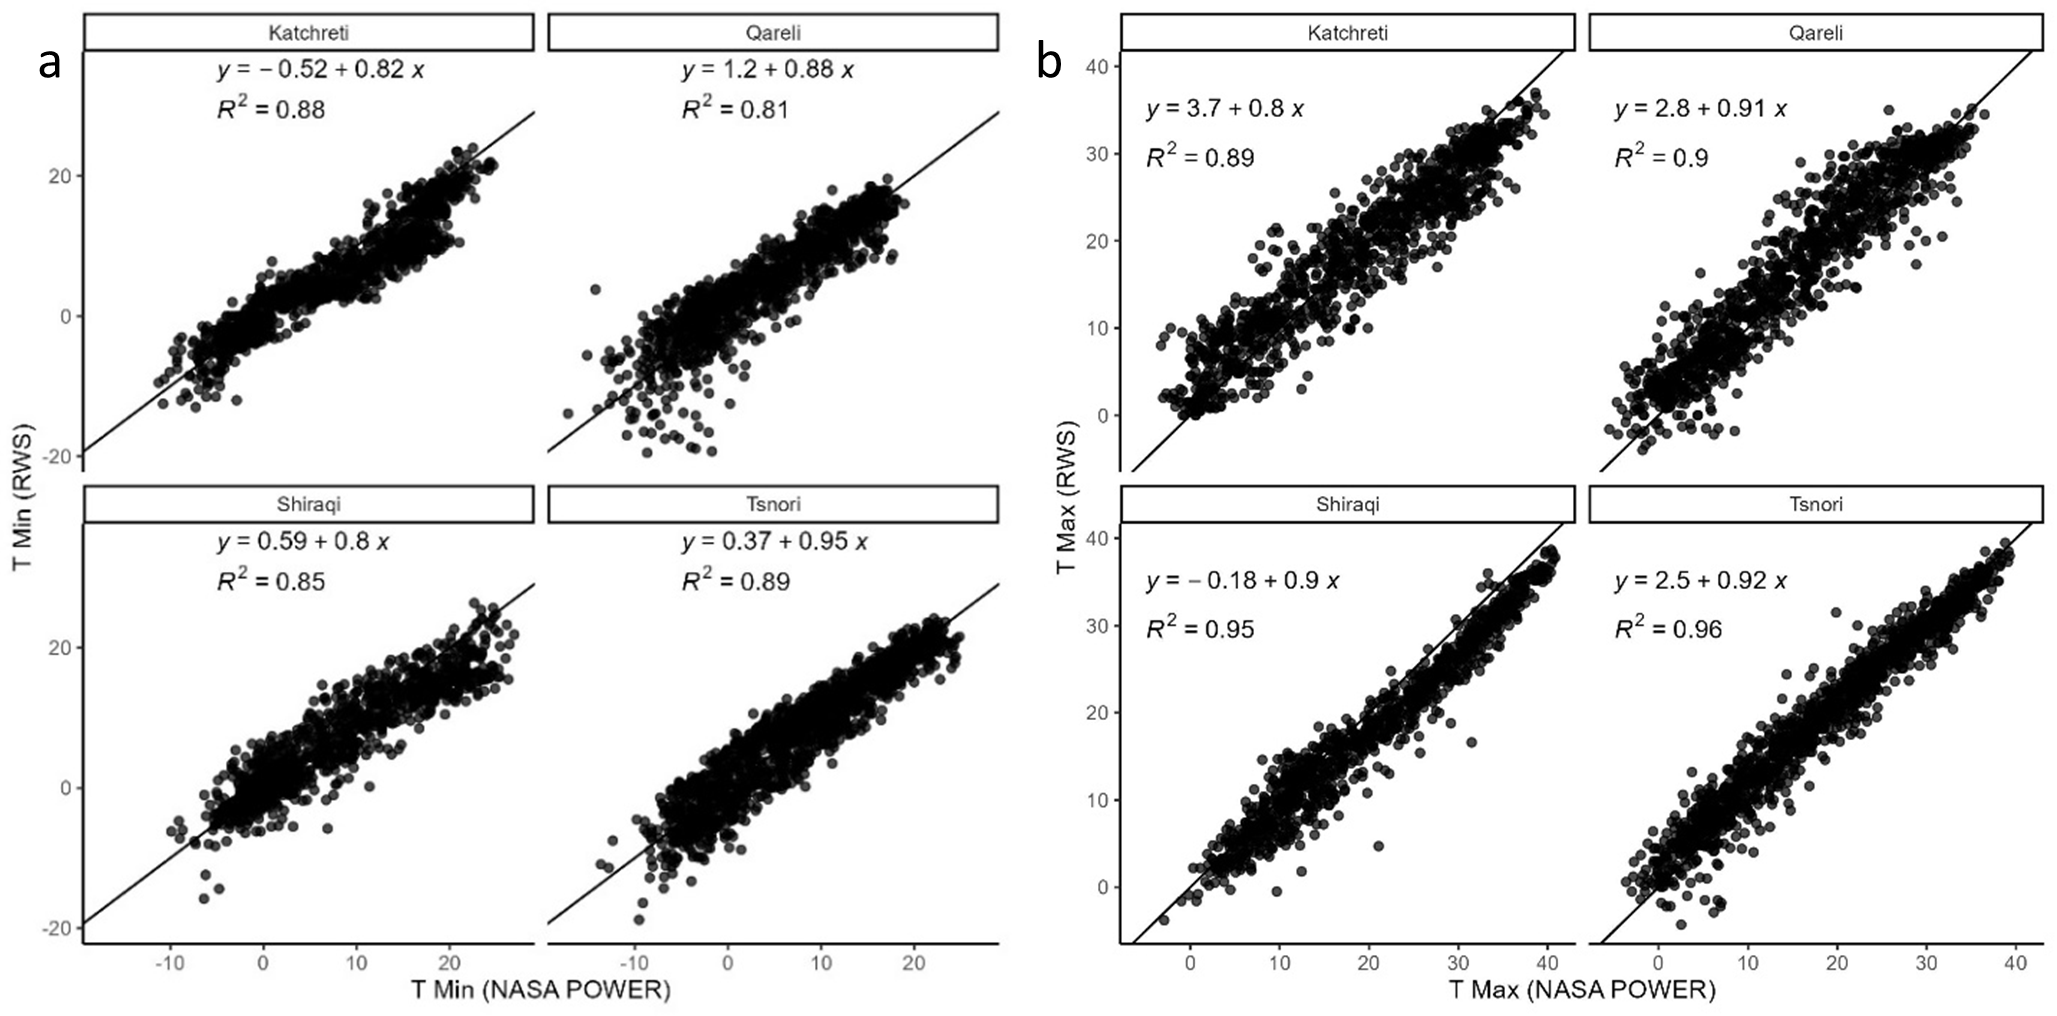
Figure 1. Validation and propagation of (a) minimum temperature and (b) maximum temperature for Katchreti (1983-1985), Qareli (1986-1988), Shiraqi (1998-2001), and Tsnori (1989-1992). Solid line represents 1:1 relationship.
Soil types and cropping systems
Within each RWS buffer, we selected the agricultural soils representing the largest wheat area until we covered at least 70% of the total area in the given buffer using soil maps from ISRIC-(WISE30sec) soil database (Batjes, 2016) from where physical properties such as drainage rate and albedo were also retrieved, while volumetric water content and bulk density were retrieved from Urushadze et al. (2017). The major soil types (Table 1) in the wheat area corresponded to Vertisols, Eutric Cambisols, Kastanozems, and Chromic Cambisols (Matchavariani and Kalandadze, 2019; Urushadze, 1997). Vertisols corresponded to the major soil type in the country with 22,605 hectares, representing 43% of the total area.
Table 1. Major soil types and their physical properties in the wheat area for running the model and estimating the water limited yield potential. Soil albedo coefficient (SALB), soil curve number for calculating the amount of runoff (CN), soil drainage coefficient (DRAINF), Volumetric water content in mm/mm at saturation (SAT), field capacity (DUL), and wilting point (LL), volumetric soil water content available for extraction by crop rots (EXTR).
| Soil Class | SALB | CN | DRAINF | SOLDEP | SAT | DUL | EXTR | LL |
|
|
|
|
| (mm) | --------------- mm mm -1---------------- | |||
| Kastanozems | 0.13 | 75 | 0.2 | 1400 | 0.483 | 0.435 | 0.284 | 0.151 |
| Vertisols | 0.12 | 83 | 0.3 | 1500 | 0.45 | 0.406 | 0.258 | 0.148 |
| Chromic Cambisols | 0.12 | 83 | 0.3 | 1200 | 0.46 | 0.336 | 0.152 | 0.184 |
| Eutric Cambisols | 0.12 | 83 | 0.3 | 1200 | 0.468 | 0.336 | 0.152 | 0.184 |
To identify the predominant cropping systems within each buffer zone, we conducted an on-farm survey in 980 commercial rainfed wheat fields for the 2022 harvest year in the regions of Kakheti, Kvemo Kartli, and Shida Kartli which are the three regions with the highest wheat production respectively, representing 93% of the country’s wheat area. Field-specific geocoordinates, agronomic management (i.e., crop rotation, tillage, pest control, planting date, etc.), and grain yield were retrieved. The survey suggested that Georgian farmers predominantly do not rotate from winter wheat; or when they do, it is usually with winter barley or another winter cereal crop. Therefore, all simulations were conducted assuming continuous winter cereal as the cropping system.
Crop model calibration and validation
We used the crop model ‘Simple Simulation Model’ (SMM)-Wheat (Soltani and Sinclair, 2012) to simulate water-limited yield (Yw). SSM simulates daily wheat growth and development free of limitations caused by diseases, insects, weeds, and nutrient deficiencies. It requires inputs of soil data (soil water holding capacity, plant available water at planting, bulk density, drainage factor, albedo, etc.), crop management (planting date, plant density etc.), and daily weather data of precipitation, solar radiation, and maximum and minimum temperature. We calibrated the model for phenology development (i.e. days to emergence, first tiller, ear emergence, anthesis, and harvest maturity) and grain yield using observed data of variety performance trials from 18 site-year combinations conducted in Georgia. At each of the 18 environments, we ran simulations using daily weather data from the nearest-ground weather station from NEA, while crop management of the experiment was reported by local researchers. Soil properties for these simulations were retrieved either from Urushadze et al. (2017) or Batjes (2016). Field experiments established with the explicit objective of determining a crop’s yield potential need to be managed very intensively and are rarely conducted. Likewise, this was not the case for the variety trials used in this exercise. In fact, fertility levels adopted in the trials averaged 99, 48, and 20 Kg of N, P and K per hectare at the 18 site-years which may be below the requirements to achieve water limited yield potential. Depending on the genotype, the presence and severity of stem rust and fusarium diseases were also reported in Dedoplistskaro, Telavi and Akhaltsikhe locations. The lack of fungicide application also renders the yields attained in these trials conservative. Therefore, we compared the simulated yield values with the highest values reported in each variety trial, aiming at ensuring that values were similar but that field values rarely exceeded simulated values. This approach is usually adopted in the absence of data reflecting a crop’s yield potential (Grassini et al., 2018). Absolute and normalized root mean square error (RMSE and RMESn) were used to test the robustness of the model comparing simulated against observed phenological stages and grain yields.
The agreement between simulated and observed data across five different winter wheat growth stages from sowing to harvest maturity in different locations of the country indicated a robust prediction of wheat phenology (RMSE = 8.3%, Fig. 2a). There was a large variation in the measured wheat grain yield across and within the site-years included in the validation of the simulated yield: Rainfed yield averaged 4.5 Mg ha-1 and ranged from 1.3 to 7.6 Mg ha-1. Across site-years, yield variability resulted from different environmental conditions experienced and management practices adopted in season. Within site-year, the variability resulted from cultivar-specific performance. Even though many of the variety performance test trials were not managed to achieve the water limited potential yield (with some trials perhaps experiencing disease pressure and other biotic yield-reducing factors), 44% of the yield measurements were above 80% of simulated Yw and 95% of the observations are below the 1:1 line (Fig. 2b) suggesting that the model did not underestimate water limited yield potential.
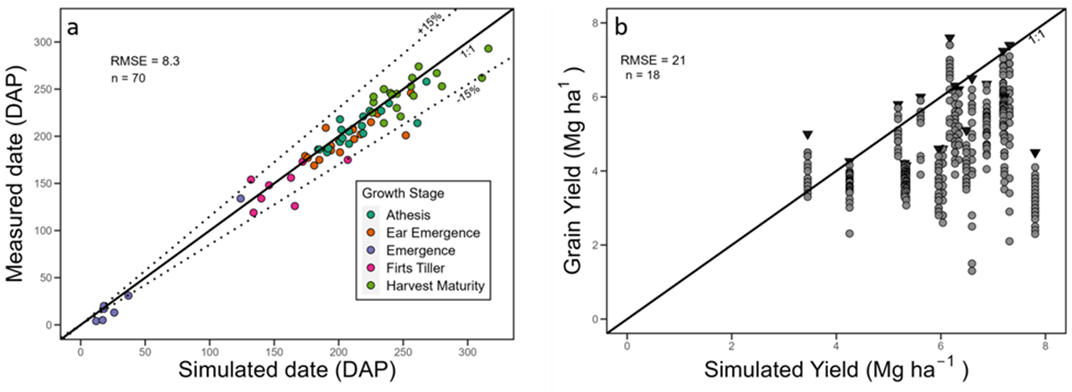
Figure 2. Model validation for (a) phenology (i.e. days after planting (DAP) for emergence, first tiller, ear emergence, anthesis, and harvest maturity) and (b) grain yield from 18 site-year combinations. Solid lines represent 1:1 relationship. For panel a, dotted lines show ±15% deviation from 1:1 line. For panel b, each point represents a site-year-variety combination and the highest observed grain yield at each site-year is shown with black triangles. Normalized root mean square error (RMSE) is also shown.
Long-term simulations and yield gap calculation
After the SSM model was satisfactorily calibrated and validated, water-limited wheat yield potential (Yw) was simulated for 12 locations across Georgia using 17 consecutive years (2005-2022) for a total of 204 site-year simulations. Inputs of soil data and weather data were derived as indicated above while crop management practices needed for simulations (typical sowing date and plan density) derived from our on-farm survey. We started the simulations on January 1st of the planting year allowing the model to calculate plant available water at sowing.
Yield gaps were calculated based on the long-term average of simulated Yw and actual farmer yield (Ya). To avoid confounding effects of temporal yield trends due to technological changes while capturing the weather variability (Van Ittersum, 2013), Ya was calculated by averaging grain yield from 2015-16 to 2021-22 growing seasons as reported by GEOSTAT (https://agriculture.geostat.ge/vegetation). Here, wheat yield is reported by region. We also computed Ya across the different spatial resolutions used in the simulations (RWSs, climate zones, and national level) using a method in which each spatial resolution was assigned a weight corresponding to the respective covered area.
References
- Agustiani, N., Deng, N., Edreira, J. I. R., Girsang, S. S., Sitaresmi, T., Pasuquin, J. M., ... & Grassini, P. (2018). Simulating rice and maize yield potential in the humid tropical environment of Indonesia. European Journal of Agronomy, 101, 10-19.
- Batjes, N. H. (2016). Harmonized soil property values for broad-scale modelling (WISE30sec) with estimates of global soil carbon stocks. Geoderma, 269, 61-68.
- Bolashvili, Nana, Andreas Dittmann, Lorenz King, and Vajha Neidze., 2018. National atlas of Georgia. Franz Steiner Verlag, p-44.
- Hargreaves, G. H., & Samani, Z. A. (1982). Estimating potential evapotranspiration. Journal of the irrigation and Drainage Division, 108(3), 225-230.
- Lollato, R.P., Patrignani, A., Ochsner, T.E., Edwards, J.T., 2016. Prediction of plant available water at sowing for winter wheat in the southern Great Plains. Agron. J. 108, 745–757.
- Matchavariani, L., & Kalandadze, B., 2019. Soil Distribution and Properties. The Soils of Georgia, 67-124.
- Soltani, A., & Sinclair, T. R.,2012. Modeling physiology of crop development, growth and yield. CABi.
- Urushadze T.F., Jorbenadze L.T., Urushadze T.T., unchulia I.O. (2017): Physical properties of the soils of Georgia. Annals of Agrarian Science, 15: 224–234
- Urushadze, T. F., 1997. The main soils of Georgia. Metsniereba, Tbilisi.
- Van Ittersum, M., Cassman K.G., Grassini, P., Wolf, J. Tittonell, P., Hochman, Z. 2013. Yield gap analysis with local to global relevance - A Review. Field Crops Research. 143, 4-17
- Van Wart J., van Bussel L.G.J., Wolf .J, Licker R., Grassini P., Nelson A., Boogaard H., Gerber J., Mueller N.D., Claessens L., van Ittersum M.K., Cassman, K.G. 2013. Use of agro-climatic zones to upscale simulated crop yield potential. Field Crops Research. 143, 44-55
- Van Wart, J., Grassini, P., Yang, H., Claessens, L., Jarvis, A., Cassman, K.G., 2015. Creating long-term weather data from thin air for crop simulation modeling. Agric. For. Meteorol. 209, 49–58.
- Verbesselt, J., Hyndman, R., Newnham, G., & Culvenor, D. (2010). Detecting trend and seasonal changes in satellite image time series. Remote sensing of Environment, 114(1), 106-115.
- Wardlow, B. D., Egbert, S. L., & Kastens, J. H. (2007). Analysis of time-series MODIS 250 m vegetation index data for crop classification in the US Central Great Plains. Remote sensing of environment, 108(3), 290-310.

Get access to the Atlas for advanced users
Download GYGA results
| Please read the license information in case you are interested in using the data from the Global Yield Gap Atlas. | |
| read more>> |
Country agronomists
Team - Kansas State University

Allen Featherstone, PhD. Agricultural Finance, Department of Agricultural Economics, KSU.

Antonina Broyaca, PhD. Post Soviet Agricultural Economist, Department of Agricultural Economics, KSU.

Kelsey Anderson Onofre, PhD. Wheat pathologist, Department of Plant Pathology, KSU.

Shawon Thiele. International Grain Program, Flour Milling and Grain Processing, KSU.

Paul Blodgett. Milling Operation Associate Director. KSU.

Martyn Draper, PhD. Associate Dean, Department of Plant Pathology, KSU.
Jorge Romero. Graduate Research Assistant, Department of Agronomy, KSU.

Dr. Romulo Lollato. Extension Wheat and Forage Specialist, Associate Professor of Agronomy, KSU.
University of Nebraska-Lincoln.
Patricio Grassini, PhD. Sunkist Distinguished Professor, Department of Agronomy and Horticulture, University of Nebraska-Lincoln.
Gonzalo Rizzo, PhD. Postdoctoral Research Associate, Department of Agronomy and Horticulture, University of Nebraska-Lincoln.
Collaborators in Georgia.
Denma Dzirkvadze, USDA, US Embassy in Tbilisi.
Gocha Shainidze, Projects Coordinator. USDA, US Embassy in Tbilisi.
Farmer of the Future, Tbilisi Georgia.
National Statistics Office of Georgia, GEOSTAT.
This page is under construction