 Overview GYGA protocols
Yield gap estimates are made at several spatial scales, from specific locations within important crop production regions (i.e. points at locations with large harvested crop area density and an associated buffer zone), to climate zones (CZs - defined by growing degree days, temperature seasonality, and aridity index), to a national average. For relatively large countries, only crops with total national harvested area of >100,000 ha are evaluated in GYGA. For smaller countries also crops with <100,000 ha are evaluated in GYGA. The underpinning principle is to select CZs and specific locations (points) and associated buffer zones within these CZs that best represent how a given crop is produced in terms of weather, soils, and cropping system. Cropping system information focuses on the proportion of the harvested area, the cropping intensity and some aspects of management (e.g. sowing date and cultivar maturity) at each of these different spatial scales. Justification for this approach comes from recent papers by van Ittersum et al (2013), Van Wart et al (2013a), Grassini et al. (2015) and Van Bussel et al. (2015). The points are defined as locations with weather data. Buffer zones of selected points with weather data include an area within 100 km of the weather station point, with a focus on harvested crop area within that buffer zone. Thus, polygons that define buffer zones are either circular with 100-km radius if the entire buffer fits within the CZ in which it is located or irregular and "clipped" by CZ boundaries if it doesn't.
Within these buffer zones, data are collected for the most prominent soil type x cropping systems combinations for a given water-regime—either rainfed, irrigated, or both if there are significant areas under both types of water regime. For a given buffer zone, Yp and/or Yw are estimated by simulation using the weather data and information about soil types and cropping systems as input to a crop model. Upscaling moves from buffer zones (if there is more than one buffer zone within a CZ), to CZs, to sub-national and national. This approach requires flexibility as to source of weather data because selected points with weather data should be well within the main cropping areas within CZs with large production areas. In cases where good quality weather stations of at least 10 years are lacking, generated 20-yr weather data from a minimum of 3-yrs actual weather data are the second best option (Van Wart et al., 2015), or derived gridded weather data (last option). Because detailed data on cropping systems and soils are required for each location, one goal of the selection protocol is to minimize the number of points and associated buffer zones needed within a country to obtain a robust estimate of Yp and/or Yw.
A premise of this method is that weather data, soil data and cropping system data are considered equally important to capture the variation within a climate zone. Data on actual farm yields are also critical for estimating Yg. Selecting CZs and locations with weather data is the starting point in the protocol to minimize the number of locations where the other essential data are required while achieving adequate coverage of crop production area to ensure assessment across a representative range of cropping systems and soils.
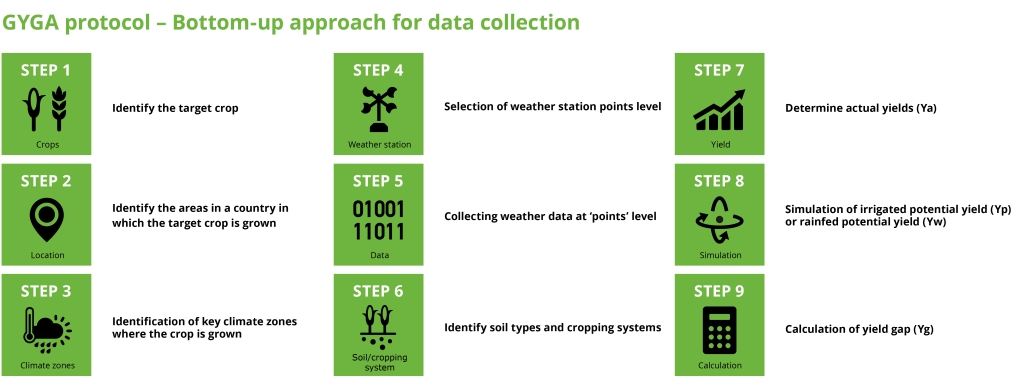
Step 1 - Identify the target crop
For relatively large countries, only crops with total national harvested area of >100,000 ha are evaluated in GYGA. For smaller countries also crops with <100,000 ha are evaluated in GYGA.
Step 2 - Identify the areas in a country in which the target crop is grown

Geospatial distribution of crop harvested area is retrieved from SPAM database (Yu et al., 2020). SPAM provides gridded data (5 arc minute resolution, approximately 10 x 10 km at the equator) on harvested area around year 2010 for 42 major staple crops, disaggregated by water regime (irrigated and rainfed). For each grid, the harvested area of rainfed crops is calculated as the sum of the harvested area reported for subsistence-, low- and high-input systems while the harvested area of irrigated crops is taken as given in the SPAM database. If national statistics on crop production are available, updated maps on crop harvested area can be generated for countries where cropland area has recently expanded (e.g., Argentina & Brazil), or where SPAM is inaccurate in relation to actual distribution of the crop harvested area.
Step 3 - Identification of key climate zones where the crop is grown

Within a country, identify CZs with >5% of total national harvested crop area for the crop/water regime (irrigated or rainfed) in question. These CZs are the "designated" CZs (DCZs) for yield gap assessment of that crop/water regime in that country. Following this approach the selected DCZs typically contain more than 50% of national crop area.
Step 4 - Selection of weather station points level
Selected weather stations can either be existing points where a weather station exists with long-term weather data of adequate quality for yield gap assessment, or a hypothetical weather station location in cases where there is large crop area but without existing weather station coverage. Selected weather stations, either actual or hypothetical, are called reference weather stations (RWS). Hypothetical RWS points will be used in addition to existing RWS for a given crop and country when existing weather stations and their associated buffer zones do not provide 50% coverage of harvested crop area. Based on a recent study in countries with relatively uniform topography, it was found that 40-50% coverage of total harvested crop area within weather station buffer zones is required for a robust estimate of Yp or Yw at a national level (Van Wart et al., 2013b). Therefore, the protocol seeks to achieve 50% coverage of national harvested crop area within buffer zones of the RWS (countries with heterogeneous topography in crop-growing regions may require a larger fraction of total crop area). Selection of RWS proceeds as follows:
(a) Identify existing qualified weather stations within DCZs. Quantify amount of harvested area for the crop in question within each buffer zone surrounding all existing qualified weather stations located within DCZs selected under step #1 above. For each of these buffer zones, exclude harvested area that falls outside the CZ in which a weather station is located. A qualified weather station has 20+ years of data of acceptable quality. Minimum data: daily max/min temperature, rainfall, and some index of humidity (relative humidity, dew point temperature, actual vapor pressure, etc). Daily solar radiation is also required, but if not available, we can obtain solar radiation data from NASA Power database.
(b) Select RWS from existing weather stations within DCZs. Identify all existing weather stations located within DCZs that contain >1% of national harvested area for the crop in question within the 100km buffer zone, clipped by the DCZ. Rank weather stations for their clipped harvested crop area. Select the weather station with greatest harvested area and then re-rank all other weather stations that are further away than 180 km of the selected station. Select from among remaining weather stations the one with greatest harvested area, re-rank, and so forth until total harvested area in buffer zones of selected weather stations reaches 50% of total national harvested crop area. If, after achieving 50% coverage, there is one or more DCZ with >5% total national crop area that do not contain a selected weather station, select an additional existing weather station in the crop production area within those DCZs (again, having >1% of national harvested area to qualify). If, after selecting among existing weather stations within DCZs, there is still less than 50% coverage, select among existing weather stations located in other CZs with <5% of national crop area if the weather station's clipped buffer zone contains >1% of national crop area. If 50% coverage is still not achieved, proceed to step 2c.
(c) The final RWS set. Existing and hypothetical weather stations selected in steps 2a, 2b, and 2c become the RWS for a specific country/crop/water regime (irrigated or rainfed) combination. The set may contain only existing weather stations or it may contain both existing and hypothetical stations. In all cases, however, harvested area within buffer zones is not double-counted. In most cases, a surprisingly small number of RWS is required to achieve 50% coverage of national crop area (Tables 2 to 9) because production of a given crop is concentrated in a few major zones of production. For a few countries and crops, however, production is highly dispersed or topography is not homogeneous such that there are a large number of small CZs. In these cases final total harvested area within buffer zones of selected RWS may not reach 50% coverage. In cases where 50% coverage is not achieved using the above methods, it would be possible to add additional CZs with <5% national crop area and weather stations with <1% national crop area if there is time and resources to do so.
Step 5 - Collecting weather data at points level
Minimum weather data requirements are explained in step 2a. For countries and crops in which there are not adequate numbers and distribution of existing weather stations, we will ask country GYGA country agronomists to search for existing weather data near the location of hypothetical RWS. Maps with preferred locations of these hypothetical RWS will be provided to country agronomists. Sources of data can include: (i) weather stations located at experimental field research and crop breeding sites used by universities, national agricultural research institutes, international CGIAR centers (e.g. ICRISAT, AfricaRice, IITA, CIMMYT, IRRI), and (ii) weather data obtained by collaborating projects also seeking actual weather data (AgMIP, CCAFS, HarvestChoice, etc). The following preference hierarchy shall be used in identifying additional weather data sources:
(a) First preference: an existing weather station with good quality, 20+yr data located as close as possible to the hypothetical RWS and within the same CZ;
(b) Second preference: an existing weather station with good quality data of at least 10 years located as close as possible to the hypothetical RWS and within the same CZ;
(b) Third preference: an existing weather station with less than 20yr weather data (but a minimum of one complete year, preferably 3-5 years). We will generate a long-term weather database for that location by calibration/correlation with NASA-Power data for temperature and solar radiation, and TRMM data for rainfall (link to detailed weather generation method).
(c) Fourth preference: a hybrid weather database. In some places there are long-term rainfall data without other required weather data. In cases where the location of these long-term rainfall data are close to locations with short-term weather data as in 3c above, a "hybrid" weather database may be created using a combination of existing weather data, generated weather data and actual rainfall data.
(d) Last option: Where no weather data are available, we will use the most appropriate source of gridded weather data such as: the NASA POWER (https://power.larc.nasa.gov) and TRMM datasets (http://trmm.gsfc.nasa.gov/), containing satellite-based rainfall data.
Step 6 - Identify soil types and cropping systems
Collection of data on cropping systems and soil type is tightly focused on the RWS selected by steps 2a, 2b and 2c above. Unfortunately few countries collect and report data on cropping systems at sub-national scales. Hence, in many cases country agronomists will be the "expert" source for estimates of the proportion of total harvested area within a RWS's buffer zone represented by a given cropping system x soil type combination. Only the most important cropping systems x soil type combinations will be considered. Site visits to the RWS locations allow collecting information about the area distribution of these systems. Soil parameters will be obtained from existing soil maps and derived crop simulation model parameters (ISRIC-WISE or if available, national maps). Information on soil properties is required to estimate Yw in rainfed systems (not needed to estimate Yp of irrigated systems). Essential soil properties include: texture, depth of root zone, and slope. Essential information on cropping systems includes: cultivar, plant density and sowing date. Find the GYGA data sheets here. These can be used to collect local crop management data.
Step 7 - Determine actual yields (Ya)
The preferred sources of data for actual yields are sub-district or municipality data that is as congruent as possible with crop area distribution within RWS buffer zones. For irrigated crops, the most recent 5-year mean for actual farm yields is preferred, rather than a shorter or longer time series, to avoid an atypical value that may occur in an unusual year and to avoid confounding effects of a yield time trend due to adoption of improved technologies (van Ittersum et al. 2013). For rainfed crops, the most recent 10-year mean for actual farm yields is preferred due to greater year-to-year variability in yield. Where such yield data are not available, actual yield data from household surveys can be used (e.g. those collected by some CGIAR Centers, the World Bank, national agricultural research programs, and other institutions) if they were taken in RWS buffers or similar areas. Where no sub-national data exist near a RWS or roughly congruent with a CZ, GYGA country agronomists may targeted survey led by the GYGA country agronomist, or use the national average yield. Detailed description of preferred methods for obtaining actual yield data can be found here.
Step 8 - Simulation of irrigated potential yield (Yp) or rainfed potential yield (Yw)

Yp and/or Yw will be simulated for each cropping system x soil type x RWS (CSxSoilxRWS) identified in step 2b or 2c. Desired attributes of crop models used for yield gap assessment are provided in Table 1. Estimated Yp and Yw values are upscaled from RWS to the CZ level by weighting for the proportion of harvested area for each RWS x Soil x CS combination. Results at CZ level are used to upscale to the national level by weighting for the proportion of harvested area for each CZ. Annual variability in Yp and Yw will be evaluated at the RWS buffer zone scale and also at CZ and national levels by weighted averaging based on harvested area.
Step 9 - Yield gap estimation 
Because time-series of actual farm yields at the RWS spatial scale are not likely available in most countries, annual variability in Yg will not be estimated. Instead, Yg will be a fixed value based on average Yp or Yw at each spatial scale and the associated value of Ya. If Ya is only available at a national level, Yg will be estimated by a single value of Ya and will vary only to the extent that Yp or Yw vary at different spatial scales, from the RWS, to CZ, administrative units and nation.
References
 Grassini P., Van Bussel L.G.J., Van Wart J., Wolf J., Claessens L., Yang H., Boogaard H., De Groot H., Van Ittersum M.K., Cassman K.G. How good is good enough? Data requirements for reliable crop yield simulations and yield-gap analysis. Field Crops Research. 177, 49-63
 Van Bussel, L.G.J., P. Grassini, J. van Wart, J. Wolf, L. Claessens, H. Yang, H. Boogaard, H. de Groot, K. Saito, K.G. Cassman and M.K. van Ittersum. 2015. From field to atlas: Upscaling of location-specific yield gap estimates. Field Crops Research. 177, 98-108
 Van Ittersum, M., Cassman K.G., Grassini, P., Wolf, J. Tittonell, P., Hochman, Z. 2013. Yield gap analysis with local to global relevance - A Review. Field Crops Research. 143, 4-17
 Van Wart J, van Bussel LGJ, Wolf J, Licker R, Grassini P, Nelson A, Boogaard H, Gerber J, Mueller ND, Claessens L, van Ittersum MK, KG Cassman. 2013a. Use of agro-climatic zones to upscale simulated crop yield potential. Field Crops Research. 143, 44-55
 Van Wart, J., Kersebaum, C.K., Peng, S., Milner, M., Cassman, K.G. 2013b. Estimating crop yield potential at regional to national scales. Field Crops Research. 143, 34-43
 Van Wart, J., Grassini, P., Yang, H.S., Claessens, L., Jarvis, A., Cassman, K.G. 2015. Creating long-term weather data from the thin air for crop simulation modelling. Agricultural and Forest Meteorology. 208, 49-58
 Yu, Q., L. You, U. Wood-Sichra, Y. Ru, A. K. B. Joglekar, S. Fritz, W. Xiong, M. Lu, W. Wu and P. Yang (2020). A cultivated planet in 2010 – Part 2: The global gridded agricultural-production maps. Earth System Science Data 12(4): 3545-3572.
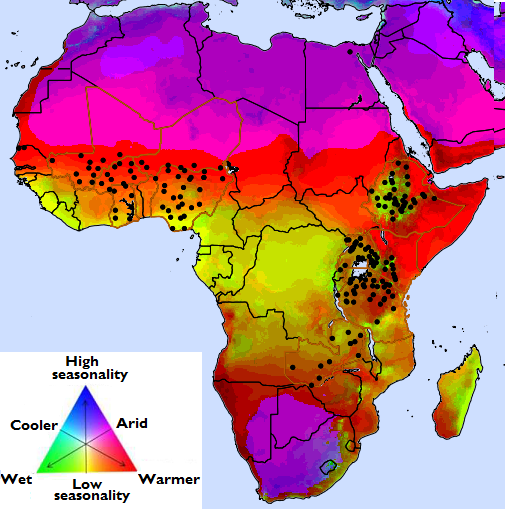
Climate zonation used in the GYGA project
Reference: Van Wart et al, 2013a.
