
 Wheat production in three Sub-Saharan African countries
Countries: Ethiopia, Kenya and Tanzania
Introduction
Wheat is the second-most-produced cereal grain behind maize in the world (FAOSTAT, 2022). The global production volume of wheat came to about over 761 Mton in the marketing year of 2019/20 (FAOSTAT, 2022). Cereals like maize, rice and sorghum, millet and wheat are major staple foods for most people in Africa. Africa produces around 25 Mton of wheat on 10 Mha (FAOSTAT, 2022). The wheat area s makes around 8% of the area used for cereal production in Africa (FAOSTAT, 2022). Around 19 percent of all wheat lands in Africa are located in the three sub-Saharan countries (Table 1).
| Table 1. Annual wheat harvest area in sub-Saharan Africa | ||
| Country | Annual wheat harvest area (1000 ha)* | Percentage of total wheat lands in Africa |
| Ethiopia | 1737.3 | 17.5 |
| Kenya | 134.9 | 1.4 |
| Tanzania | 58.5 | 0.6 |
| Total | 1930.7 | 19.4 |
| * The data are from FAOSTAT for the period from 2015 to 2020 | ||
The crop model
The Python Crop Simulation Environment of WOFOST (WOrld FOod STudies) was used for the implementation (https://pcse.readthedocs.io/en/stable/). This model takes into account phenological development, leaf development, light interception, CO2 assimilation, root growth, transpiration, respiration and partitioning of assimilates (de Wit et al., 2019). Daily weather data, crop parameters, soil parameters, and management data are needed to run the model and simulate water-limited potential yield (Yw). The source of different data to do the simulations for each country were presented in Table 2.
| Table 2.Sources of data to simulate rainfed wheat potential yield and for calculating the yield gap. Note: GYGA CA = GYGA country agronomist | |||||
| | Sowing window | Daily weather data | Cultivar thermal time requirment** | Soil data | Actual yield |
| | GYGA CA | Measured and Propagated data* | | | GYGA CA |
| | GYGA CA | Propagated data | | | |
| | GYGA CA | Propagated data | | | GYGA CA |
| * Details are in Van Wart et al. (2015) ** Calculated based on the sowing, flowering and maturity timing information from the GYGA country agronomist using weather data and cardinal temperatures *** AFrica Soil Information Service (Leenaars J.G.B., 2018) | |||||
Reference weather stations
The simulation was performed for 25 weather stations in the three? countries (Table 3). These were identified as reference weather stations for rainfed wheat in SSA countries based on the GYGA protocol (https://www.yieldgap.org/web/guest/methods-overview). SPAM (Spatial Production Allocation Model; https://www.mapspam.info/) maps, together with expert knowledge from agronomists and experts from these countries, were used to identify the rainfed wheat harvested area (You et al., 2009, 2014). Following van Bussel et al (2015), a total of 25?? buffer zones were selected for rainfed wheat in SSA countries (Table 3, Fig. 1)
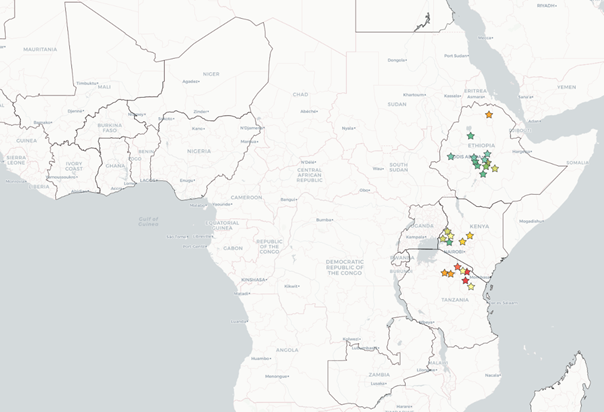
Figure 1. The location of the reference weather stations for rainfed wheat in Sub-Saharan African countries
Weather data
Weather data used in simulation included daily solar radiation, maximum and minimum temperatures, precipitation, vapor pressure deficit, and wind speed. Weather data for selected weather stations were subjected to quality control measures to fill in missing data and identify and correct erroneous values. In the case of those stations with only few years of weather data (Table 3), long-term weather data were generated based on correlations between measured weather data and NASA-POWER maximum and minimum temperatures (Van Wart et al., 2015). In the case of solar radiation and rainfall, the data from NASA-POWER were used without any correction (NASA, 2022). In the case of buffers without measure weather data at all, named the virtual stations (Table 3), uncorrected NASA-POWER data were used for all meteorological variables needed for crop modeling.
Soil information
Soil data was obtained from the AFSIS[1] (Leenaars et al., 2018). Soil moisture content at field capacity, soil moisture content at wilting point, not infiltrating fraction of rainfall, initial soil water, and maximum rootable depth of the soil were obtained as soil parameters for each weather station.
Management data
The simulations were done under water-limited conditions with no limitation for nutrients. So, the sowing date within the buffers of the weather stations was the main management input data needed to run the model. For this purpose, the common sowing windows of rainfed wheat for each buffer were retrieved through agronomists from the countries (Fig. 2). These sowing windows and an algorithm were used to estimate the sowing date for each year for each weather station. The algorithm calculates the amount of cumulative rainfall for seven consecutive days into the sowing window. The last day of this period resulting in more than 20 millimeter cumulative rainfall was considered as the sowing date. If there was no consecutive seven days with at least 20 millimeter rainfall into the sowing window, the last day of the sowing window was as the sowing date.
Crop parameters
The crop parameters consist of parameter names and the corresponding parameter values that are needed to parameterize the components of the crop simulation model. These are crop-specific values regarding phenology, assimilation, respiration, biomass partitioning, etc. The same crop parameters were used for the simulations in all the weather stations except the parameters for phenology. The phenological parameters including the thermal time requirement from emergence to flowering and from flowering to harvesting were calculated based on the observed data for sowing, emergence, flowering and harvesting using the cardinal temperature and weather data at each weather station (Table 3).
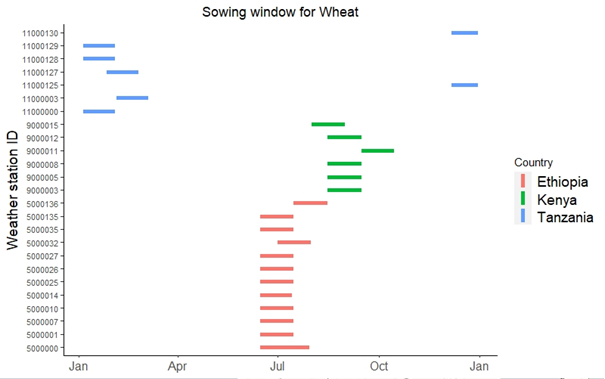
Figure 2. The sowing window to plant rainfed wheat at the weather stations in Sub-Saharan Africa countries; The name and information of each station are presented in Table 3.
| Table 3. Rainfed wheat cropping system and management information and the thermal time requirement of the cultivars at each weather station | ||||||||||||
| Country | Station name | Station ID* | Longitude | Latitude | Elev | Water regime | Cropping system | Cropping cycle | Sowing window | Thermal time requirement** | ||
| Start | End | From emergence to flowering | From flowering to maturity | |||||||||
| Adet | Ethiopia | 5000000 | 37.48 | 11.27 | 2240 | Rainfed | Single: wheat | 1 | 15-Jun | 30-Jul | 1310 | 1160 |
| Ambo | Ethiopia | 5000001 | 37.835 | 8.96 | 2100 | Rainfed | Single: wheat | 1 | 15-Jun | 15-Jul | 1210 | 1080 |
| Ayira | Ethiopia | 5000007 | 35.33 | 9.06 | 1700 | Rainfed | Single: wheat | 1 | 15-Jun | 15-Jul | 1300 | 1150 |
| Butajira | Ethiopia | 5000010 | 38.22 | 8.08 | 3252 | Rainfed | Single: wheat | 1 | 15-Jun | 15-Jul | 1130 | 1000 |
| Debrezeit | Ethiopia | 5000014 | 39 | 8.72 | 1900 | Rainfed | Single: wheat | 1 | 15-Jun | 14-Jul | 1150 | 1020 |
| Kulumsa | Ethiopia | 5000025 | 39.15 | 8 | 2241 | Rainfed | Single: wheat | 1 | 15-Jun | 15-Jul | 1050 | 940 |
| Mekele | Ethiopia | 5000026 | 39.47 | 13.52 | 1970 | Rainfed | Single: wheat | 1 | 15-Jun | 15-Jul | 1080 | 950 |
| Melkassa | Ethiopia | 5000027 | 39.33 | 8.4 | 1550 | Rainfed | Single: wheat | 1 | 15-Jun | 15-Jul | 1210 | 1080 |
| Sheno | Ethiopia | 5000032 | 39.3 | 9.344 | 2848 | Rainfed | Single: wheat | 1 | 1-Jul | 31-Jul | 890 | 790 |
| Woliso | Ethiopia | 5000035 | 37.97 | 8.55 | 2060 | Rainfed | Single: wheat | 1 | 15-Jun | 15-Jul | 1300 | 1150 |
| Eth_rfwt2 | Ethiopia | 5000135 | 38.83 | 7.17 | 2675 | Rainfed | Single: wheat | 1 | 15-Jun | 15-Jul | 1200 | 1060 |
| Eth_rfwt3 | Ethiopia | 5000136 | 40.11 | 7.77 | 2475 | Rainfed | Single: wheat | 1 | 15-Jul | 15-Aug | 1540 | 1360 |
| Kakamega | Kenya | 9000003 | 34.46 | 0.17 | 1399 | Rainfed | Single: wheat | 1 | 15-Aug | 15-Sep | 1150 | 1050 |
| Kericho | Kenya | 9000005 | 35.16 | -0.22 | 1356 | Rainfed | Single: wheat | 1 | 15-Aug | 15-Sep | 1150 | 1050 |
| Kitale | Kenya | 9000008 | 34.96 | 0.97 | 1850 | Rainfed | Single: wheat | 1 | 15-Aug | 15-Sep | 1150 | 1050 |
| Meru | Kenya | 9000011 | 37.39 | 0.5 | 1044 | Rainfed | Single: wheat | 1 | 15-Sep | 15-Oct | 1150 | 1050 |
| Nakuru | Kenya | 9000012 | 36.6 | -0.16 | 2557 | Rainfed | Single: wheat | 1 | 15-Aug | 15-Sep | 1150 | 1050 |
| Eldoret | Kenya | 9000015 | 35.3 | 0.48 | 2120 | Rainfed | Single: wheat | 1 | 1-Aug | 31-Aug | 1150 | 1050 |
| Arusha | Tanzania | 11000000 | 36.63 | -3.32 | 1488 | Rainfed | Single: wheat | 1 | 5-Jan | 3-Feb | 1300 | 1200 |
| Kia | Tanzania | 11000003 | 37.07 | -3.43 | 896 | Rainfed | Single: wheat | 1 | 4-Feb | 5-Mar | 1300 | 1200 |
| Tan_rfwt1 | Tanzania | 11000125 | 36.92 | -4.37 | 1313 | Rainfed | Single: wheat | 1 | 6-Dec | 30-Dec | 1300 | 1200 |
| Tan_rfwt3 | Tanzania | 11000127 | 36.06 | -2.88 | 914 | Rainfed | Single: wheat | 1 | 26-Jan | 24-Feb | 1300 | 1200 |
| Tan_rfwt4 | Tanzania | 11000128 | 35.32 | -3.65 | 1395 | Rainfed | Single: wheat | 1 | 5-Jan | 3-Feb | 1300 | 1200 |
| Tan_rfwt5 | Tanzania | 11000129 | 37.52 | -5.03 | 1041 | Rainfed | Single: wheat | 1 | 5-Jan | 3-Feb | 1300 | 1200 |
| Tan_rfwt6 | Tanzania | 11000130 | 34.65 | -3.54 | 1405 | Rainfed | Single: wheat | 1 | 6-Dec | 30-Dec | 1300 | 1200 |
| * If the last three number of a station ID is more or equal to 100, the station is as a virtual station ** The cardinal temperatures to calculate the thermal time for sorghum are 0◦C as the base temperature, 30◦C or more than 30◦C as the optimum temperature. | ||||||||||||
Reference
de Wit, A., Boogaard, H., Fumagalli, D., Janssen, S., Knapen, R., van Kraalingen, D., . . . van Diepen, K. (2019). 25 years of the WOFOST cropping systems model. Agricultural Systems, 168, 154-167. doi:10.1016/j.agsy.2018.06.018
https://pcse.readthedocs.io/en/stable. Accessed on 2022-06-10
https://www.fao.org/faostat/en/#data. Accessed on 2022-06-10
https://www.mapspam.info. Accessed on 2022-06-10
https://www.yieldgap.org/web/guest/methods-overview. Accessed on 2022-06-10
Leenaars, J.G., Claessens, L., Heuvelink, G.B., Hengl, T., González, M.R., van Bussel, L.G., Guilpart, N., Yang, H. and Cassman, K.G., 2018. Mapping rootable depth and root zone plant-available water holding capacity of the soil of sub-Saharan Africa. Geoderma, 324, pp.18-36.
NASA. NASA-Agroclimatology methodology. Available at: https://power.larc.nasa.gov/data-access-viewer/. 2022. Accessed on April 10, 2022.
van Bussel LG, Grassini P, Van Wart J, Wolf J, Claessens L, Yang H, Boogaard H, de Groot H, Saito K, Cassman KG, van Ittersum MK. From field to atlas: upscaling of location-specific yield gap estimates. Field Crops Research, 2015, 177: 98-108.
Van Wart, J., Grassini, P., Yang, H., Claessens, L., Jarvis, A. and Cassman, K.G., 2015. Creating long-term weather data from thin air for crop simulation modeling. Agricultural and Forest Meteorology, 209, pp.49-58.
You L, Wood S, Wood-Sichra U, Wu W. Generating global crop distribution maps: From census to grid. Agricultural Systems, 2014, 127: 53-60.
You L, Wood S, Wood-Sichra U. 2009. Generating plausible crop distribution maps for Sub-Saharan Africa using a spatially disaggregated data fusion and optimization approach. Agricultural Systems, 99: 126-140.
[1] AFrica Soil Information Service

Get access to the Atlas for advanced users
Download GYGA results
| Please read the license information in case you are interested in using the data from the Global Yield Gap Atlas. | |
| read more>> |