Argentina
Description of cropping systems, climate, and soils
Crop production area in Argentina occupies near 35 million ha. Major crops are soybean, wheat, maize, and sunflower, which account for ca. 90% of total crop area, and the country is one of the largest producers and exporters of these crops.
Table 1. Average (2016-2021) total production, harvested area, and average yield of maize, soybean, wheat, and sunflower in Argentina. Source: Ministerio de Agricultura, Ganadería y Pesca de la República Argentina (https://www.magyp.gob.ar/datosabiertos/).
| Production | Harvested area | Yield | |
| (M t) | (M ha) | (t/ha) | |
| Maize | 51.4 | 7.0 | 7.4 |
| Soybean | 50.3 | 17.2 | 2.9 |
| Wheat | 17.5 | 5.8 | 3.0 |
| Sunflower | 3.3 | 1.6 | 2.1 |
Argentina has a favorable climate for rainfed crop production, with total annual rainfall that ranges, across the crop producing regions, from 600 (south-west) to 1400 mm (north-east). Despite the potential for irrigation expansion, current irrigated area is negligible (<3% of total area planted with maize, soybean, and wheat). Dominant soils correspond to the Mollisols order, without impedances to rooting, except for some regions in the southern Pampas where a caliche layer limits rooting depth. A detailed description of weather, soil and cropping systems can be found in Hall et al. (1992). Remarkable features of current Argentine agriculture are: (i) around 56% of the crop area is rented out by absent landowners to local producers; (ii) 90% of the agricultural land is under no-till (Bolsa de Cereales de Buenos Aires); (iii) soybean is the main crop occupying in almost half of the total cropped area; (iv) 99% of soybean is transgenic glyphosate resistant while 95% of maize is Bt; and (v) around 30% of the soybean is sown as a double crop after harvest of winter crops (Calviño and Monzon, 2009).
The present version, released in Sept 2023, has expanded and updated the previous analysis of yield gaps conducted in Argentina (Aramburu Merlos et al., 2015) and includes:
- New locations.
- Updated results for old locations
- Inclusion of sunflower.
- Disaggregated analysis of yield gaps for maize and soybean crops based by cropping system (i.e., early or late maize and single or second soybean).
- Accounting for the influence of shallow groundwater on yield potential.
Weather data and selection of buffers
Two weather networks were used: INTA (https://siga.inta.gob.ar/#/) and SMN (https://www.smn.gob.ar/), from which daily meteorological data for the past 30+ years were obtained, including daily maximum and minimum temperatures and precipitation. To complement meteorological station data, NASA-POWER (https://power.larc.nasa.gov/) was used as a source of incident solar radiation data, as daily solar radiation measurements were missing in some stations.
Within all relevant climatic zones (CZ) (>5% of national cropland), we selected reference weather stations (RWS) to retrieve past daily meteorological data. We then created 100-km radius areas around each station, trimmed by the edges of the CZ. This area around the meteorological stations is referred to as a 'buffer,' and buffers containing more than 1% of the national harvested area for the respective crop were included in the analysis. In total, 32 (maize and soybean), 26 (wheat), and 11 (sunflower) buffers were selected based on the distribution of harvested area. The set of buffers included in our analysis represents over 70% of the total harvested area for each of the four crops in Argentina, while the CZs where these buffers are located represent at least 85% of the national area.
Soils
The 2-3 dominant soil series were identified for each RWS buffer based on data provided by the Soil Division of INTA. Briefly, a two-step procedure was followed: first, national soil maps (1:50,000 or 1:500,000) were used to calculate the area of all soil series within the buffer, and (ii) 2-3 dominant soil series were selected for crop simulations based on the relative area within the buffer, land use suitability, and farmers' choice of soil for growing a given crop (for example, maize is typically grown on the best soils). Soil inputs required for crop simulations, such as soil depth, runoff curve number, lower and upper limits for water retention, etc., were derived from soil series descriptions following Gijsman et al. (2003) and Dardanelli et al. (2003). Rooting depth was set at 2.4 meters, based on Dardanelli et al. (1997, 2003), except for six locations (Coronel Suarez, Tres Arroyos, Balcarce, Tandil, Azul, and La Dulce) where rooting depth is limited by a caliche layer.
The area with presence of shallow water table was estimated based on a survey study carried out by Bolsa de Cereales de Buenos Aires. Local experts on each buffer were asked to inform the proportion of fields with groundwater in the upper 3.5 meters of the soil profile during the crop season of each crop. Given the inter-annual and spatial variation in water table depth, the influence of water table on rainfed crop yields will vary from nil to no water limitation, or even negative if the water table is too close to the surface. To account for the spatio-termporal fluctuation in water table depth, we assumed no water limitation in 50% of the reported area with presence of shallow water table in each buffer and, for that condition, we assumed water-limited yield potential to be equal to the yield potential without water limitation.
Crop system and management information for crop simulations
Management practices for each RWS buffer zone were retrieved from local agronomists. Requested information include average planting dates, dominant cultivar name and maturity, and actual and optimal plant population density. The provided data were subsequently corroborated by other local and national experts.
Simulations were conducted for widespread cultivars in each buffer using crop modeling for maize (CERES), wheat (CERES), sunflower (CROPGRO), and soybeans (CROPGRO) embedded in DSSAT v 4.7 (Jones et al., 2003; Hoogenboom et al., 2019) for a period of 35 years (1986-2021). Genetic coefficients were previously derived and validated by Monzon et al. (2007, 2012), Aramburu-Merlos et al. (2015) and Rodriguez et al. (2023) based on data from rainfed and irrigated experiments. To account for differences in initial soil moisture at planting time between years, the most typical crop sequence was simulated in each buffer, assuming 50% of available soil moisture in the first year of the series (1986), while subsequent seasons considered the available soil moisture at the end of the preceding crop and accounted for precipitation during the fallow period and the crop cycle. Only simulation results from 1990 to 2021 were included in the analysis. In buffers where wheat, maize, and soybean were present, a typical 3-year rotation was simulated, consisting of soybean-wheat/second soybean-maize. In buffers where wheat area was not important (e.g., NOA and some buffers in NEA), a 2-year soybean-maize rotation was simulated. In order to simulate every crop species in each year, we run simulations starting with all possible phases of each crop rotation.
For each buffer, up to two planting dates were simulated for maize. Early planting typically takes place between September/October in central and southern buffers, while in northern sites early planting starts in late December. Late planting in central and southern buffers occurs from late November in the south to December in central sites.
Additionally, in buffers where sunflower was present, a sunflower-wheat/soybean-maize rotation was also simulated (La Pampa and South Buenos Aires province) with sunflower planted in October. In the north-east region, we simulated two crop rotations; one with sunflower planted in regular date (late September) sunflower-maize-soybean (one crop per year) and another with sunflower planted early (August) followed by a maize crop in the same year in a sequence composed by sunflower/maize-soybean (three crops in two years). Sunflower simulated yields were not adjusted by oil concentration in grains given its relatively low range of variation across buffers and years (52.5-55.5%).
As indicated above, for soybean and maize we present results separately for each crop system (early and late maize, single and second crop soybean). In addition, we show results aggregated for each crop species using a weighted average based on harvested area of each crop system.
Actual yields
Lastly, district-level data on harvested acreage and average yields for each crop were obtained from the Ministerio de Agricultura, Ganaderia y Pesca de la Republica Argentina (https://www.magyp.gob.ar/datosabiertos/). Statistics from the last 8 available growing seasons (2013/14 to 2020/21) were used to calculate average yields in each buffer for maize, sunflower, wheat, single soybean and second soybean. Given that maize statistics are not discriminated between early and late planting, a yield coefficient for each season was applied to derived separate actual yields based on regional yield data collected by Bolsa de Cereales de Buenos Aires.
Irrigated rice – Argentina
Description of cropping systems, climate, and soils
Annual rice production area in Argentina occupies around 200,000 ha, mostly located in the northeast region, where rice is grown as a single crop per year. All rice in Argentina is direct seeded and irrigated.
Climate and soils
The rice production region in Argentina is located between 27° and 33° S and has a subtropical to temperate climate, with an average annual rainfall ranging from 1200 mm (southwest) to 1600 mm (northeast). Average temperature is 19.8 °C, ranging from 20.7 °C (North) to 17.6°C (South), with highest and lowest temperatures in January and July, respectively (Bianchi & Cravero, 2010). Rice crops are grown mainly on lowland with poor drainage (gleysols and podzols.
Data Sources and Assumptions for rice yield gap assessment
Weather data and reference weather stations (RWS)
Seven reference weather stations (RWS) were selected within five climate zones; associated RWS buffers cover 58% of the total rice area in the country.
Daily weather data (10+ years) were retrieved from different sources. Data for four weather stations were retrieved from INTA: Federal, Calchaqui, Colonia Benites, and Mercedes (http://siga2.inta.gov.ar/#/data). In the case of two stations (Paso de los Libres and Concordia), data were retrieved from nearby stations located in Uruguaiana (Brazil) and Salto (Uruguay), which were retrieved from INMET (https://mapas.inmet.gov.br/) and INIA (www.inia.uy/investigación-e-innovación/unidades/GRAS/Clima/Banco-datos-agroclimatico). All weather variables required for simulating irrigated yield potential using Oryza(v3) model (daily radiation, Tmin, Tmax) were retrieved. In the case of stations with less than 10 years of weather data or large data gaps, calibrated NASA-POWER data (http://power.larc.nasa.gov/) using observed data were used to generate long-term records or fill in data gaps following van Wart et al (2015).
Crop system and management information for crop simulations
The rice crop season extends from late September-October to March-April, with the optimal sowing dates in early October. Rice is direct seeded, and flooded 15-35 days after emergence. Simulations were performed using ORYZA v3 (Bouman et al., 2004). Genetic coefficients for the rice cultivar IRGA 424 (which is widely grown in Argentina) were previously calibrated based on data from previous irrigated experiments in Brazil (Ribas et al., 2016; 2017; 2020). The ORYZA model, using the calibrated coefficients for IRGA 424, was evaluated on its ability to reproduce observed phenology and grain yields using data from well-managed experiments across Argentina, showing satisfactory performance (Figure 1). These experiments included a total of 12 site-years.
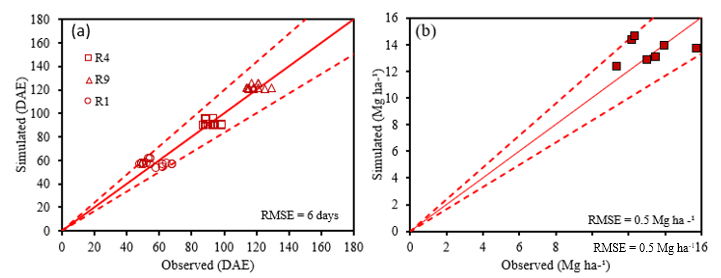
Figure 1. Comparison of simulated and observed phenology (a) and grain yield (b) for rice experiments grown under potential conditions in Argentina. The solid red line represents y = x and the dashed red lines represents ± 20% deviation from the y -x line. RMSE = mean square root of error. The phenological stages of rice are based on the scale of Counce et al. (2000).
Actual yields
Actual rice yields (at 14% moisture content) for this study were retrieved from Ministerio de Agricultura, Ganaderia y Pesca (https://datos.magyp.gob.ar/dataset?q=arroz). Since there has been no technological trends over the past 10 years, we used yield records from the 2009-2020 period. A weighted average yield was calculated based on the average yield reported for the municipalities located within the buffer zone and the relative contribution of each department to the total crop harvested area in the buffer zone. Yield gap (Yg) was calculated as the difference between average Yp and average farmers yield.
References:
Cassman, K. G. 1999. Ecological intensification of cereal production systems: Yield potential, soil quality, and precision agriculture. Proceedings of the National Academy of Sciences of the United States of America 96: 5952–9.
Dardanelli, J.L., Bachmeier, O.A., Sereno, R., Gil, R., 1997. Rooting depth and soil water extraction patterns of different crops in a silty loam Haplustoll. Field Crops Res. 54, 29–38.
Dardanelli, J.L., Calmon, M.A., Jones, J.W., Andriani, J.M., Diaz, M.P., Collino, D.J., 2003. Use of a crop model to evaluate soil impedance and root clumping effects on soil water extraction in three Argentine soils. Trans. ASAE 46, 1265-1275.
Evans, L. T. 1993. Crop Evolution, Adaptation, and Yield. Cambridge, UK: Cambridge University Press.
Gijsman, A.J., Jagtap, S.S., Jones, J.W., 2002. Wading through a swamp of complete confusion: how to choose a method for estimating soil water retention parameters for crop models. Eur. J. Agron. 18, 75–105.
Jones, J.W., Hoogenboom, G., Porter, C.H., Boote, K.J., Batchelor, W.D., Hunt, L.A., Wilkens, P.W., Singh, U., Gijsman, A.J., Ritchie, J.T., 2003. The DSSAT Cropping System Model. Eur. J. Agron. 18: 235–265.
Monzon, J.P., Sadras, V.O., Abbate, P.A., Caviglia, O.P., 2007. Modelling management strategies for wheat-soybean cropping systems in the Southern Pampas. Field Crops Res. 101, 44-52.
Monzon, J.P., Sadras, V.O., Andrade, F.H., 2012. Modelled yield and water use efficiency of maize in response to crop management and Southern Oscillation Index in a soil-climate transect in Argentina. Field Crops Res. 130, 8-18.
Rodriguez, I.M., Mercau, J.L., Cipriotti, P.A., Hall, A.J., Monzon, J.P., 2023. Fine-tuning the CROPGRO-Sunflower model and its application to the quantification of crop responses to environmental and management variables. Field Crops Research, 300, 108986.
van Ittersum, M. K., and R. Rabbinge. 1997. Concepts in production ecology for analysis and quantification of agricultural input-output combinations. Field Crops Research 52: 197–208.
van Wart, J., L. G. J. van Bussel, J. Wolf, R. Licker, P. Grassini, A. Nelson, H. Boogaard, J. Gerber, et al. 2013. Use of agro-climatic zones to upscale simulated crop yield potential. Field Crops Research 143: 44–55.
References Irrigated Rice
Ribas G.G.; Streck N.A.; Duarte Junior A.; Nascimento M.F.; Zanon A.J.; Silva, M.R. 2017. Number of leaves and phenology of rice hybrids simulated by the SimulArroz model. Pesquisa Agropecuária Brasileira 51: 1907-1917.
Ribas G.G.; Streck N.A.; Lago I.; Zanon A.J.; Waldow D.A.G.; Duarte Junior A.J.; Nascimento M.F.; Fontana V. 2016. Accumulated dry matter and grain yield in flooded hybrid rice simulated with the SimulArroz model. Pesquisa Agropecuária Brasileira 51: 1907-1917.
Ribas,G.G.; Streck, N.A.; Duarte Junior, A.J.; Ribeiro, B.R.S.M.; Rossato, I.G.; Richter, G.L.; Beixaira, K.P.; Pereira, V.J. Zanon, A.J., 2020. An update of new rice cultivars in the SimulArroz model. Revista Pesquisa Agropecuaria Brasileira, v.55, e00865, 2020. DOI: https://doi.org/10.1590/S1678-3921.pab2020.v55.00865.
Bianchi, R. A.; Cravero, S. A. C. Atlas Climático Digital De La República Argentina, INTA, 2010. Available at: https://inta.gob.ar/sites/default/files/script-tmp-texto_atlas_climtico_digital_de_la_argentina_110610_2.pdf.
Bouman, B.A.M., Kropff, M.J., Tuong, T.P., Wopereis, M.C.S., Ten Berge, H.F.M., & Van Laar, H.H. 2001. ORYZA2000: modeling lowland rice. International Rice Research Institute, Los Baños, Philippines, and Wageningen University and Research Centre, Wageningen, Netherlands, 235 pp.
Grassini, P., Van Bussel, L.G.J.,, P., Van Mart, J., Wolf, J., Claessens, L., Yang, H., Boogaard, H., De Groot, H., Van Ittersum, M.K. and Cassman, K.G. 2015. How good is good enough? Data requirements for reliable crop yield simulations and yield gap analysis. Field Crops Research. 177, 49-63.
Van Wart, J., Van Bussel, L.G.J., Wolf J, Licker, R., Grassini, P., Nelson, A., Boogaard, H., Gerber, J., Mueller N.D., Claessens L., Van Ittersum M.K., Cassman K.G. 2013a. Use of agro-climatic zones to upscale simulated crop yield potential. Field Crops Research. 143, 44-55.
Van Wart, J., Kersebaum, C.K., Peng, S., Milner, M., Cassman, K.G. 2013b. Estimating crop yield potential at regional to national scales. Field Crops Research. 143, 34-43.
Van Wart, J., Grassini, P., Yang, H.S., Claessens, L., Jarvis, A., Cassman, K.G., 2015 Creating long-term weather data from the thin air for crop simulation modelling. Agric. For. Meteoro. 209-210, 45-58.

Get access to the Atlas for advanced users
Download GYGA results
| Please read the license information in case you are interested in using the data from the Global Yield Gap Atlas. | |
| read more>> |
Country agronomists