
 Food security analysis: from local to global
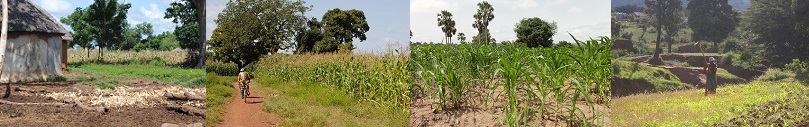
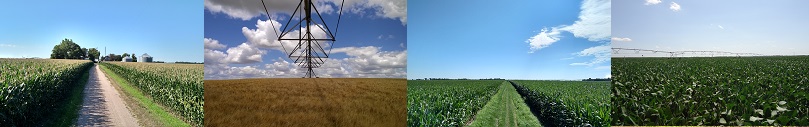
Given limited land and water resources available for crop production and population soon to exceed 9 billion, ensuring food security while protecting carbon-rich and biodiverse rainforests, wetlands, and grasslands depends on our ability to increase current crop yields on existing farmland through sustainable intensification. The Global Yield Gap and Water Productivity Atlas (GYGA) provides robust estimates of untapped crop production potential on existing farmland based on current climate and available soil and water resources.
Results from the atlas can serve for identifying regions with greatest potential for investment in agricultural development and technology transfer and to monitor impact over time. Likewise, the atlas provides essential information to assess the feasibility of a country to achieve food self-sufficiency through crop intensification and, if this cannot be achieved, for assessing how much extra land clearing or food import will be needed to meet future demand for food. The atlas is a foundation for studies aiming to explain and mitigate yield gaps and investigate impact of climate change, land use, and environmental footprint of agriculture.
Developing the Atlas
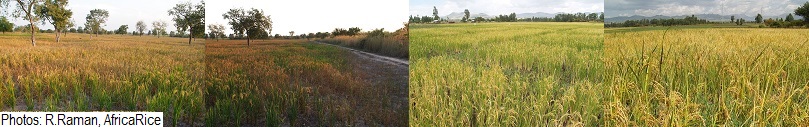
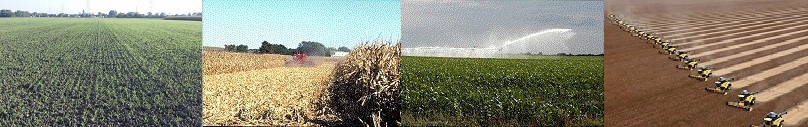
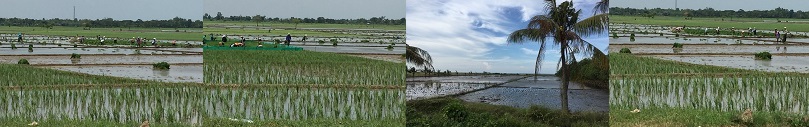
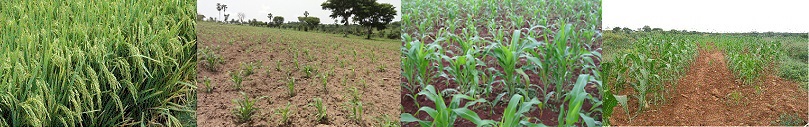
GYGA is an international project requiring collaboration among agronomists with knowledge of production systems, soils, and climate governing crop performance in their countries. A standard protocol for assessing yield potential (Yp), water-limited yield potential (Yw), yield gaps (Yg) and water productivity (WP) is applied for all crops and countries based on best available data, robust crop simulation models, and a bottom-up approach to upscale results from location to region and country. GYGA aspires for global coverage of yield gaps for all major food crops and countries that produce them. The first phase of the project (2012-2015) focussed on cereal crops. Recently, the crop list has been extended with soybean, sugarcane and potato. Detailed maps and associated databases are displayed and available to download.
Currently the country by crop combinations included in the atlas account for 91%, 86%, 58* and and 82%, respectively, of the global rice, maize, wheat and soybean production.
| CROP | % GLOBAL AREA | % GLOBAL PRODUCTION |
|---|---|---|
| Rice | 88% | 91% |
| Maize | 76% | 86% |
| Wheat | 55% | 58% |
| Soybean | 71% | 82% |
NEW: A publication on cropping system-imposed yield gap: Proof of concept on soybean cropping systems in Uruguay and one on future food self-sufficiency in Iran
Please look at our references pages or look inside 'read more' below.
read more >> Data from the Global Yield Gap Atlas: Disclaimer and licenses
The Atlas has a new look and feel. With support for multiple devices.

- China:
- Soybean
- USA:
- Updates on Maize
- sub-Saharan Africa:
- Updates on actual yields for cereals
- Europe:
- Potato, pea
- Updates on cereals
- Paraguay:
- Maize, wheat and soybean
- Australia:
- Updates on wheat and rapeseed