
 China Maize
Data Sources and Assumptions (following GYGA protocols) for maize in China
Harvested area
Data of maize harvested area were obtained from 2009 China’s National Bureau of Statistics (NBS). The data were at the county level. We used the SPAM2005 (http://mapspam.info) to distinguish irrigated and rainfed areas.
Weather data and reference weather stations (RWS)
Daily weather data for the period from 1985 to 2014 for a total of 756 stations were obtained from China meteorological Administration (http://data.cma.cn). Average maize growing degree days (GDD) was calculated from the weather data for the maize growing season from 1985 to 2014.
China is a large country with a wide distribution of maize area and great variation of climate. To reduce the variation of climate effect on Yp and Yw, the entire maize growing area was divided to four regions based on the agro-ecological conditions: Northeast (NE), North China Plain (NCP), Northwest (NW), and Southwest (SW). For irrigated maize, RWS buffer zones in each region were selected following the protocol described in Van Wart et al. (2013) and van Bussel et al. (2015). Firstly, draw the distribution of irrigated maize area and weather stations on the China map, and superimpose the agro-climatic zones (CZs) on top of the map. Secondly, draw circles with 100 km radius surrounding all weather stations as the buffer zones. Thirdly, overlap the buffer zones with the CZs to ensure the homogeneity of the agricultural climate in each buffer zone. Finally, select the buffer zones in each region according to their covered harvested maize area from big to small until the total harvested area in buffer zones is greater than 50% of each region. The selected buffer zones were the RWS buffer zones. The same procedure was followed for rainfed maize. In total, 70 RWS buffer zones were selected for the irrigated maize and 106 for the rainfed maize. For irrigated maize, the area of RWS buffer zones covered 67% of the total irrigated area, while the value was 51% for the rainfed maize.
Actual yields
Data of actual yield were obtained from farm surveys conducted during 2007–2008. The farm surveys included face-to-face interviews with farmers. The questionary was designed to capture relevant data (e.g., grain yield, planting density, harvest date, fertilizer and irrigation management). For irrigated maize, a total of 1988 sets of data were obtained with 693 in the NE, 214 in the NW, and 1081 in NCP, which covered 33 RWS buffer zones in total. For the rainfed maize, a total of 2049 sets of data were obtained with 736 in NE, 229 in NW, 963 in NCP, and 121 in SW, which covered the 46 RWS buffer zones in total.
Crop Model
The Hybrid-Maize Model (Yang et al, 2006) was used to estimate Yp and Yw. The model has been tested and widely used in China (Bai et al., 2010; Chen et al., 2011; Meng et al., 2013). For Yp, model input includes daily weather data (i.e., solar radiation, maximum and minimum temperatures, precipitation, wind speed, and relative humidity), maize hybrid maturity, sowing date, and planting density. For Yw, extra information is required, including maximum rooting depth, soil texture, and bulk density. No model calibration was conducted.
Soil data
Soil texture data, including proportion of clay and silt, were retrieved from ISRIC-World soil information, WISE international soil profile dataset (http://www.isric.org).
Maize management practices
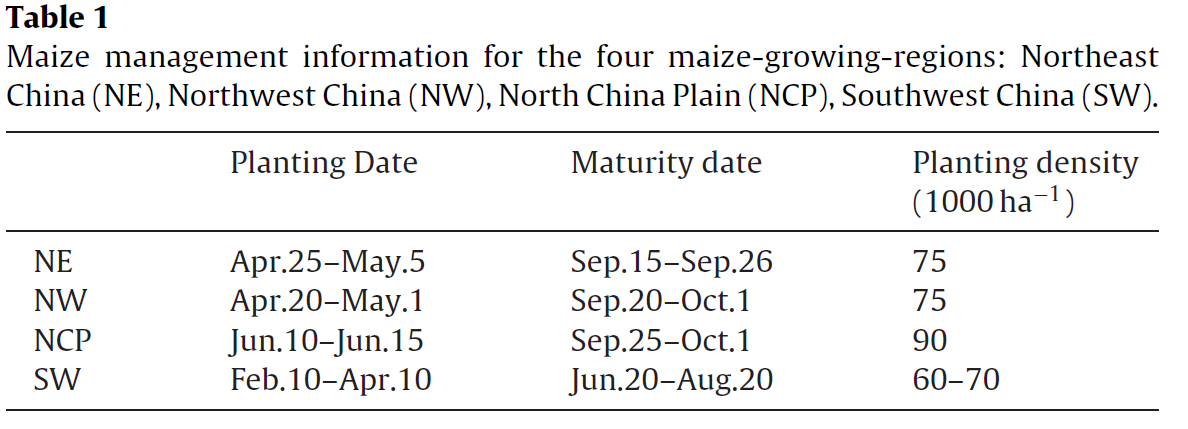
Crop management information, including sowing date, maturity date, and planting density, was provided by local agronomic experts (Table 1)
References
Bai, J., Chen, X., Dobermann, A., Yang, H., Cassman, K.G., Zhang, F., 2010. Evaluation of NASA satellite-and model-derived weather data for simulation of maize yield potential in China. Agron. J. 102, 9–16
Chen, X.P., Cui, Z.L., Vitousek, P.M., Cassman, K.G., Matson, P.A., Bai, J.S., Meng, Q.F.,Hou, P., Yue, S.C., Roemheld r, V., Zhang, F.S., 2011. Integrated soil–crop system management for food security. Proc. Natl. Acad. Sci. U. S. A. 108, 6399–6404.
Meng, Q., Hou, P., Wu, L., Chen, X., Cui, Z., Zhang, F., 2013. Understanding production potentials and yield gaps in intensive maize production in China.Field Crop Res. 143, 91–97.
van Bussel, L.G., Grassini, P., Van Wart, J., Wolf, J., Claessens, L., Yang, H., Boogaard,H., de Groot, H., Saito, K., Cassman, K.G., van Ittersum, M.K., 2015. From field toatlas: upscaling of location-specific yield gap estimates. Field Crop Res. 177,98–108.
van Wart, J., van Bussel, L.G., Wolf, J., Licker, R., Grassini, P., Nelson, A., Boogaard, H.,Gerber, J., Mueller, N.D., Claessens, L., van Ittersum, M.K., Cassman, K.G., 2013.Use of agro-climatic zones to upscale simulated crop yield potential. Field CropRes. 143, 44–55.
Yang, H., Dobermann, A., Cassman, K.G., Walters, D.T., 2006. Features, applications,and limitations of the Hybrid-Maize simulation model. Agron. J. 98, 737–748.
Liu, Baohua., Xinping Chen, Qingfeng Meng, Haishun Yang, Justin van Wart. 2017. Estimating maize yield potential and yield gap with agro-climatic zones in China: Distinguish irrigated and rainfed conditions. Agricultural and Forest Meteorology. Vol. 239 (2017), 108-117.

Get access to the Atlas for advanced users
Download GYGA results
| Please read the license information in case you are interested in using the data from the Global Yield Gap Atlas. | |
| read more>> |