 Iran
Iran
Iran is the world's 18th-most-populous country with about 81 million inhabitants. With a land area of 1,648,195 km2, Iran is the 17-th largest in the world. The country lies between latitudes 24° and 40° N, and longitudes 44° and 64° E in the southeast of Asia. Almost 60 percent of the country is dominated by mountainous area, and the rest consists of deserts and arid lands. Iran includes two major mountain systems, named Alborz and Zagros (Fig. 1). These mountain ridges which run east and southeast from the northwest corner of the country, surrounding two uninhabited deserts, Dasht-e Lut and Dasht-e Kavir.

Fig. 1. Topography of Iran (from Wikimedia).
Land and cultivation
Total cultivated area has been fluctuating around 12 million ha over the past 25 years (Mesgaran et al., 2016). Distribution of agricultural area between different plant groups is indicated in Table 1 which is based on data from 2011 to 2016. It should be noted that figures in Table 1 do not indicate physical area under cultivation because where double cropping has been practiced, the land area under both the first and the second crop has been summed up. Total cultivated area by crops, orchards and vegetables is 14,448,101 ha, irrigated area is 8,447,010 ha (58%) and rainfed area is 6,001,091 ha (42%). Crop production takes place on 11,319,360 ha of which is 5,695,046 ha is irrigated (50%) and 5,624,314 ha is rainfed.
Table 1. Distribution of cultivated land (ha) between different plant groups and irrigated and rainfed systems. Where double cropping is practiced, the land under the first and the second crop has been summed up. Greenhouse area is 5,864 ha.
| Category | Irrigated | Rainfed | Sum |
| Crop | 5,695,046 | 5,624,314 | 11,319,360 |
| Orchard | 2,221,803 | 334,633 | 2,556,436 |
| Vegetable | 530,162 | 42,144 | 572,306 |
| Sum | 8,447,011 | 6,001,091 | 14,448,102 |
Table 2 includes area, production and average yield of different crops in Iran. Crops covered by GYGA-Iran are marked by asterisk. Of the covered crops, wheat, barley, rapeseed are grown as both irrigated and rainfed. More than 90% of chickpea and lentil are produced under rainfed conditions, while alfalfa, rice, maize (for grain and silage), potato, common bean, sugar beet, cotton and soybean are mainly grown under irrigated conditions in the country.
Table 2. Area, production and average yield of different crops of Iran using 2011-2016 data from Ministry of Agriculture.
| Crop | Area (ha) | Production (million ton) | Yield (kg/ha) |
| Wheat* | 6,170,164 | 10.65 | 1730 |
| Barley* | 1,680,021 | 2.98 | 1779 |
| Alfalfa* | 620,985 | 5.46 | 8851 |
| Rice* | 555,014 | 2.30 | 4269 |
| Chickpea* | 470,265 | 0.21 | 457 |
| Grain maize* | 242,821 | 1.67 | 6897 |
| Silage maize* | 183,244 | 9.14 | 50800 |
| Potato* | 164,110 | 4.87 | 30050 |
| Lentil* | 134,574 | 0.07 | 537 |
| Common bean* | 116,095 | 0.22 | 1876 |
| Sugar beet* | 102,885 | 4.86 | 47449 |
| Cotton* | 91,670 | 0.20 | 2219 |
| Sugarcane | 83,579 | 6.52 | 78004 |
| Sunflower | 74,010 | 0.11 | 1553 |
| Rapeseed* | 73,771 | 0.12 | 1684 |
| Soybean* | 64,905 | 0.14 | 2213 |
| Clover | 61,090 | 0.83 | 15012 |
| Sesame | 59,033 | 0.05 | 875 |
| Other Crops | 371,125 | 9.10 | 25233 |
*Covered by GYGA-Iran so far.
Climate
Spatial distribution of annual precipitation and air temperature are presented in Fig. 2 and 3. Fig. 4 presents climate zones of Iran based on GYGA-ED climate classification method.

Fig 2. Spatial distribution of precipitation in Iran (1961–2005); only major isohyets map is shown (Khalili and Rahimi, 2018).

Fig. 3. Spatial distribution of mean annual air temperature over Iran (1961–2005) (Khalili and Rahimi, 2018).

Fig. 4. Climate classification of Iran using GYGA-ED method (van Wart et al., 2013).
Examining GYGA-ED climate zone classification for Iran reveals that there are 72 climate zones in the country and agriculture is practiced in 68 climate zones. Thus, the diversity of climates is very high. Irrigated land mainly occurs in 15 climate zones and more than 50% of irrigated lands are in climate zones 5003, 4003, 5002, 8003 and 6003 (Fig. 5). Therefore, irrigated agriculture is performed in dry climates with a high temperature fluctuation. Rainfed agriculture is located in 19 climates zones, but more than 50% of rainfed area is located in climate zones 4103, 4003 and 3103, i.e. relatively cold climates (Fig. 5).
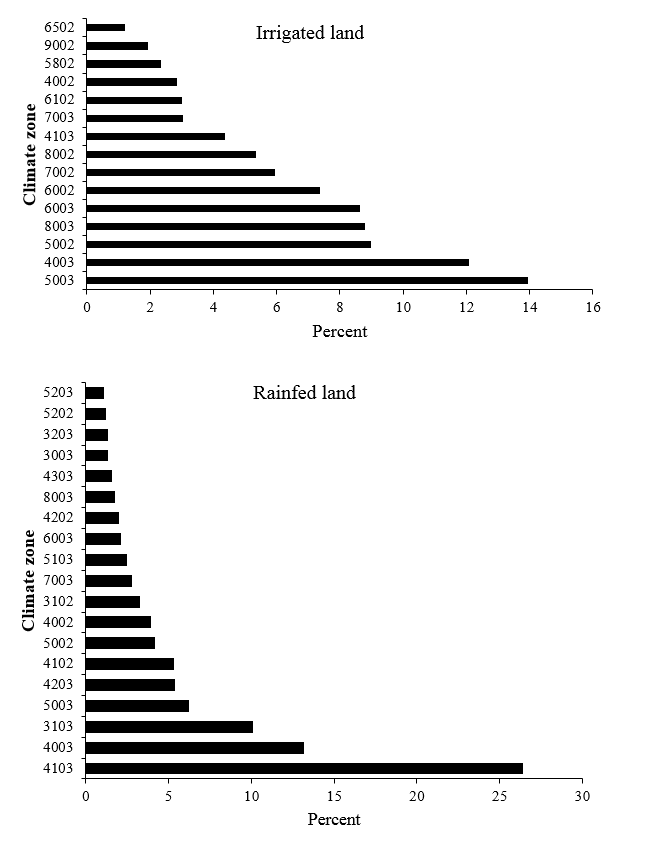
Fig. 5. Dominant climate zones with irrigated and rainfed land in Iran.
Selecting weather stations
Selection of reference weather stations (RWS) and buffer zones for each crop was based on GYGA protocol as described by Van Wart et al. (2013) and van Bussel et al. (2015). The number of climate zones, percentage coverage (based on climate zone) and the number of RWSs for each crop are shown in Table 3. Weather data were quality checked for extreme or missing values and unusual changes using WeatherMan utility of DSSAT (Jones et al., 2003). Solar radiation data for all RWSs were calculated from sunshine hours using this utility software. For 23 weather stations, it was needed to generate few years of weather to have a complete data set for simulation of potential yield (Appendix I), which was again performed using WeatherMan. Generated weather consisted 6.5% of all weather data used. This percentage was different for each crop, but was never more than 10% for a single crop.
So far, weather data from 133 weather stations across the country were used for the selected crops (Fig. 6; Appendix I). Besides one station, all other stations were synoptic weather stations. Of the 133 weather stations, 19 are hypothetical. All the hypothetical stations are ‘first preference' type as defined by GYGA protocol, i.e., they are existing weather stations with good quality data (>20 years) as close as possible to the hypothetical RWS and within the same climate zone.
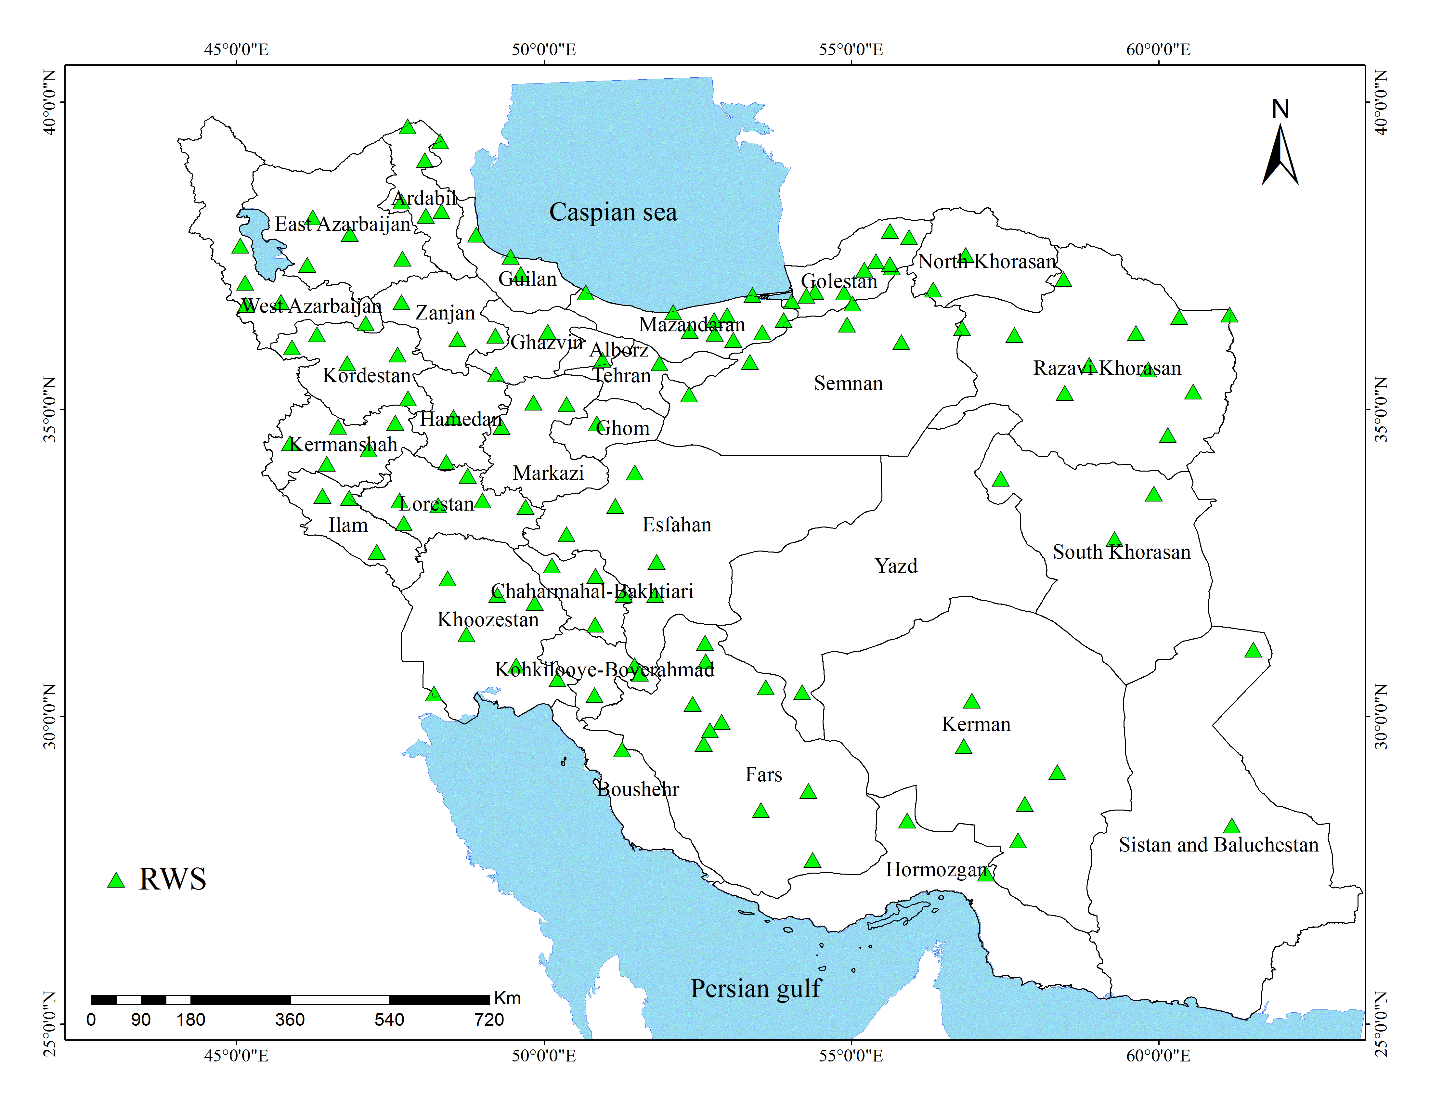
Fig. 6. Reference weather stations selected for GYGA-Iran.
Table 3. Total area, percentage coverage (within the climate zones), the number of climate zones (CZ) and the number of reference weather stations (RWS) for different crops in GYGA-Iran.
| Crop | Area (ha) | Coverage (%) | #CZ | #RWS |
| Irrigated wheat | 2,242,475 | 90.5 | 15 | 29 |
| Rainfed wheat | 3,692,938 | 89.7 | 18 | 32 |
| Irrigated barley | 734,993 | 89.6 | 12 | 48 |
| Rainfed barley | 1,036,931 | 87.9 | 17 | 38 |
| Irrigated rice | 559,632 | 88.1 | 14 | 21 |
| Rainfed chickpea | 492,202 | 91.1 | 11 | 20 |
| Irrigated maize | 198,206 | 91.0 | 13 | 23 |
| Irrigated potato | 164,439 | 94.0 | 15 | 35 |
| Irrigated bean | 114,593 | 92.5 | 12 | 25 |
| Irrigated sugar beet | 110,631 | 92.7 | 13 | 28 |
| Irrigated cotton | 76,217 | 97.2 | 9 | 23 |
| Irrigated rapeseed | 44,496 | 92.4 | 16 | 22 |
| Rainfed rapeseed | 16,963 | 93.5 | 12 | 21 |
| Irrigated soybean | 57,462 | 90.1 | 9 | 9 |
Soil data
Soil information is a key input to the models for potential yield estimation under rainfed conditions, yet it is difficult to obtain extensive, quantitative, and geo-referenced soil property data for the areas (or regions) of interest. Generic/Prototypical Soil Profiles from HarvestChoice (http://droppr.org/data/map/hc27) which itself is based on information from HWSD and WISE were used (Koo and Dimes, 2010). HC27 already contains 27 soil profiles. The soil profiles in HC27 are based on three criteria that crop models are most responding to, i.e. (i) texture, (ii) rooting depth, and (iii) organic carbon content. By classifying three levels for each category and setting their boundary conditions, Koo and Dimes (2010) generated 27 generic soil profiles (HC27) in formats compatible with DSSAT and APSIM (we didn't derive/create the profiles). The profiles include curve number for calculation of run-off. There was a good agreement between soil texture from HC27 and local, point observations of soil texture.
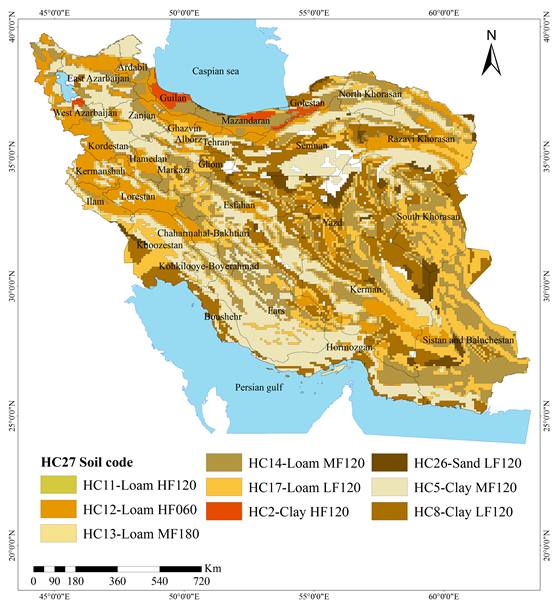
Fig. 7. Soil map of Iran (Koo and Dimes, 2010).
Evaluation of the HC27 soil map and the map of Iran agricultural lands showed that 9 soil profiles are dominant in Iran. In irrigated lands, dominant soil profiles are Soil #5 (clay with medium fertility and a depth of 120 cm) and Soil #17 (loam with low fertility with a depth of 120 cm) (Fig. 8). In rainfed lands, these are Soil #5 (clay with medium fertility and a depth of 120 cm) and Soil #12 (loam, high fertility with a depth of 60 cm) (Fig. 8). Table 4 includes main characteristics of the dominant soils.
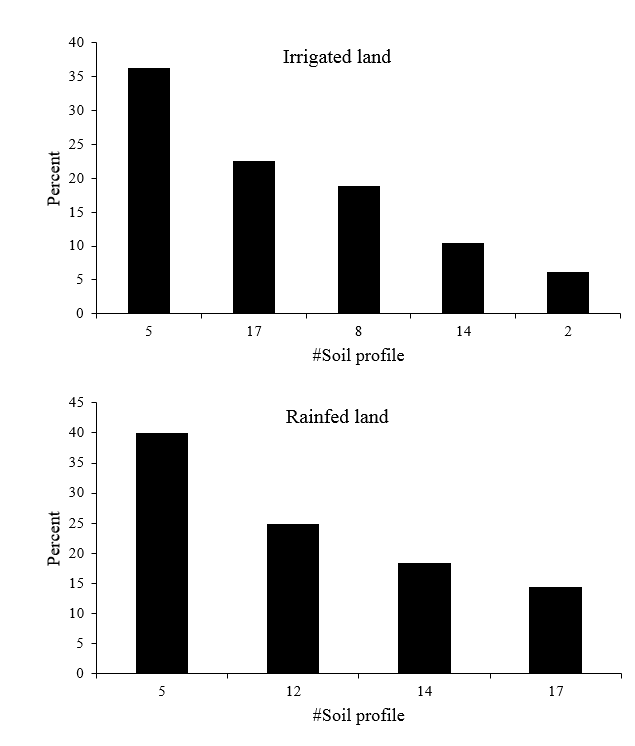
Fig. 8. Dominant soil profiles in irrigated and rainfed land of Iran.
Table 4. Prevalent soil profiles and their characteristics in cultivated area of investigated crops in GYGA-Iran based on HC27 soil map of Koo and Dimes (2010). SOC is soil organic carbon (%), SOLDEP is soil depth (mm), SALB is soil albedo, DRAINF is soil drainage factor, SAT is soil water content at saturation (m3 m-3), DUL is soil water content at drained upper limit (m3 m-3), and LL is soil water content at lower limit (m3 m-3).
| Soil profile | SOC | SOLDEP | SALB | CN | DRAINF | SAT | DUL | LL |
| HC2-Clay HF120 | >1.2 | 1200 | 0.05 | 85 | 0.2 | 0.46 | 0.40 | 0.23 |
| HC5-Clay MF120 | 0.7-1.2 | 1200 | 0.05 | 85 | 0.2 | 0.46 | 0.40 | 0.23 |
| HC8-Clay LF120 | 0-0.7 | 1200 | 0.05 | 85 | 0.2 | 0.46 | 0.40 | 0.23 |
| HC12-Loam HF060 | >1.2 | 600 | 0.10 | 75 | 0.5 | 0.41 | 0.30 | 0.18 |
| HC14-Loam MF120 | 0.7-1.2 | 1200 | 0.10 | 75 | 0.5 | 0.41 | 0.30 | 0.18 |
| HC17-Loam LF120 | 0-0.7 | 1200 | 0.10 | 75 | 0.5 | 0.41 | 0.30 | 0.18 |
Soil codes (IFPRI Harvest Choice): 2=Clay, high fertility, 120 cm depth; 5=Clay, medium fertility, 120 cm depth; 8=Clay, low fertility, 120 cm depth; 12=Loam, high fertility, 60 cm depth; 14=Loam, medium fertility, 120cm depth; 17=Loam, low fertility 120 cm depth.
Crop area maps, harvested area and actual yields
The main source for distribution of harvested area in GYGA is SPAM crop distribution maps. However, in GYGA-Iran specific maps were generated for crops under analysis as we found that SPAM maps were not accurate at least for some crops. To do this, data of harvested area were obtained from more than 400 counties over the country from the Ministry of Agriculture. Maps with crop area distribution of each crop were generated using crop area at each county and distribution of irrigated or rainfed lands of Iran. Uniform crop distribution was assumed at county level if a crop is grown in that county. Fig. 9 compares crop area map for potato obtained in GYGA-Iran with that of SPAM2005, as an example.
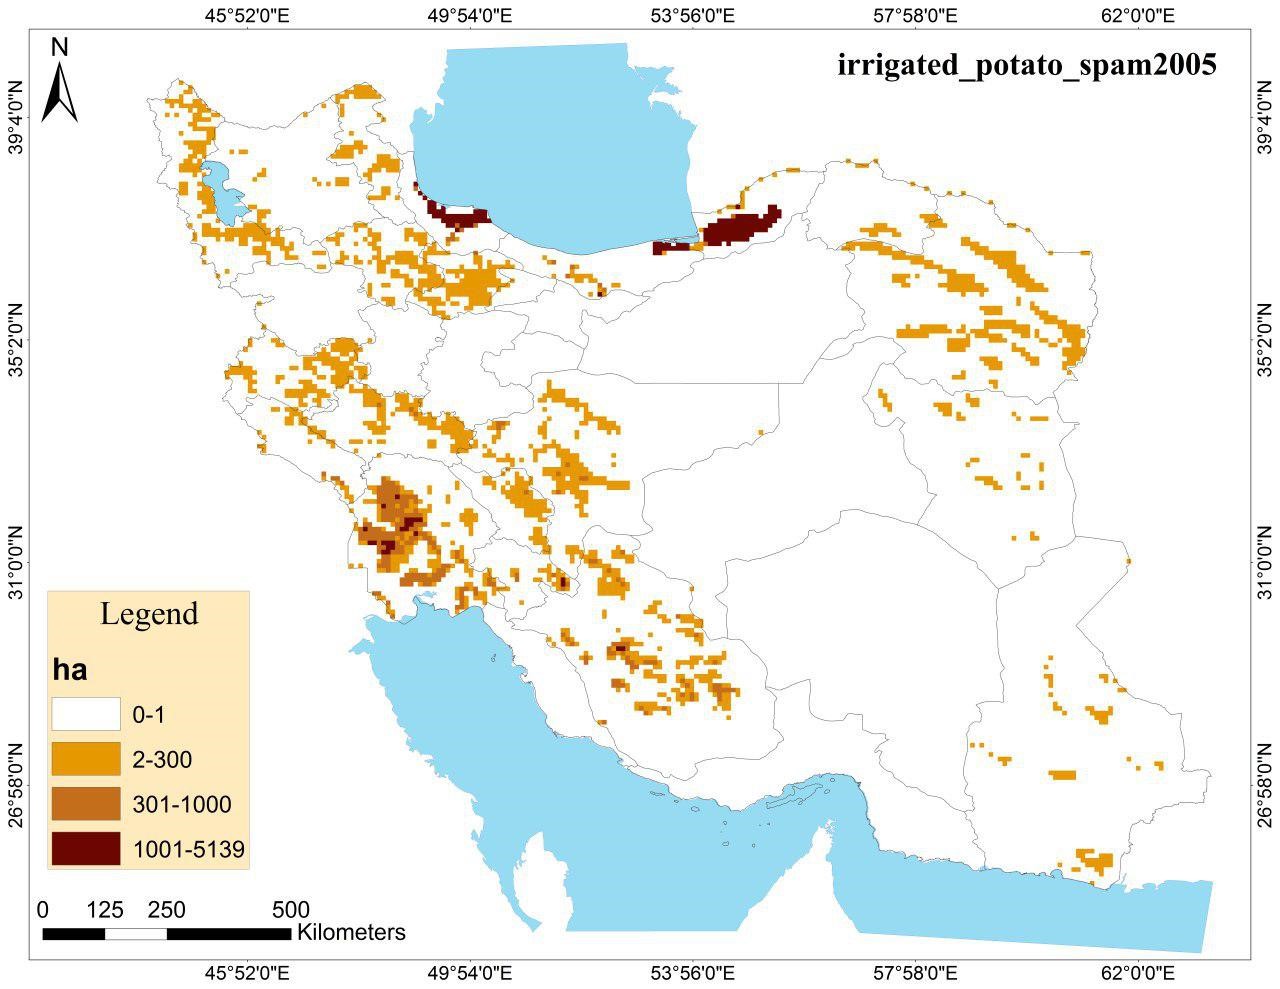
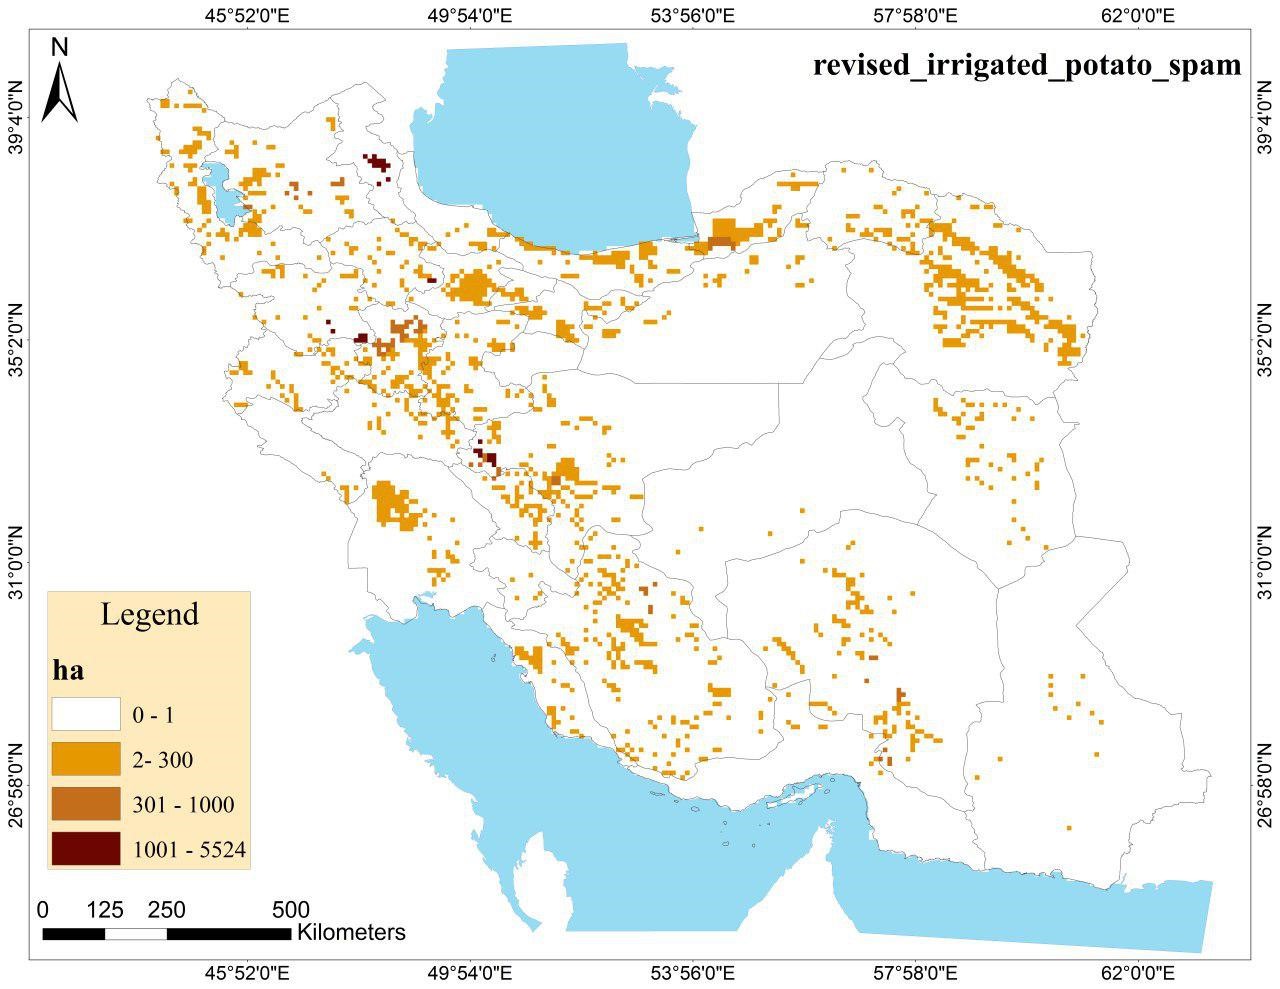
Fig. 9. SPAM2005 crop area map for potato in Iran (above) and revised potato area map prepared for GYGA-Iran (below).
Data of harvested area, production and yield of crops were obtained from the Ministry of Agriculture for the period of 2001-2015, but crop distribution maps were prepared using 2014 to 2016 data. Actual yield for each buffer was calculated as weighted average where weights were county areas in the buffer.
Cropping system and crop management information
Cropping systems in Iran are wheat or rice based. Wheat based systems can be seen all over the country, but rice based systems are mainly found in the north (Caspian Sea coast) and in some other patchy areas in the country. Depending on temperature, single or double cropping is practiced. In warmer climates with mild winter, double cropping using wheat or rice is dominant, but in regions with cold winters ‘one-crop-per-year' system is used, so that wheat or rice are grown alone or in sequence (rotations) with other crops.
Typical crop management information was gathered from local experts with the help of Agricultural Research, Education and Extension Organization (AREEO) centers and institutes all over the country. Actual yield and potential yield were also items in the questionnaires. For GYGA simulations, typical planting and harvesting dates were used, but for other management factors (e.g. planting density) optimal values were used.
Crop simulation
SSM crop models were used for the simulation of potential yields (Yp, Yw). The models are based on T.R. Sinclair's approach in crop modeling. The history of the model development goes back to the 1970s (Sinclair and de Wit, 1976). The models have been developed and tested for wheat, barley, chickpea, lentil, common bean, peanut, cowpea, maize and sorghum (Sinclair, 1986; Amir and Sinclair, 1991; Hammer et al., 1995; Soltani and Sinclair, 2011; Soltani et al., 2013) during the past 40 years. Soltani and Sinclair (2012) presented principles and procedures in developing SSM models.
Not all above mentioned evaluation results refer to Iran's conditions. Thus, for GYGA-Iran, we parameterized and tested the models for all crops using data from Iran. For this purpose, experimental data from major producing areas of these crops in Iran were collected. The data were divided into two parts, one part for model parameterization and the other part for independent model testing. Furthermore, potential yield data from the major producing areas were separately used for model testing for potential yield. Appendix II includes evaluation results for selected crops in GYGA-Iran.
Disclaimer
GYGA-Iran was conducted with the support from Gorgan University of Agricultural Sciences and Natural Resource (GUASNR) and Agricultural Research, Education and Extension Organization (AREEO) of Ministry of Agriculture.
References
Amir, J., Sinclair, T.R., 1991. A model of water limitation on spring wheat growth and yield. Field Crops Res. 29, 59-69.
Hammer, G.L., Sinclair, T.R., Boote, K.J., Wright, G.C., Meinke, H., Bell, M.J., 1995. A peanut simulation model: I. Model development and testing. Agron. J. 87: 1085-1093.
Jones, J.W., Hoogenboom, G., Porter, C.H., Boote, K.J., Batchelor, W.D., Hunt, L.A., Wilkens, P.W., Singh, U., Gijsman, A.J., Ritchie, J.T., 2003. The DSSAT cropping system model. Eur. J. Agron. 18, 235-265.
Khalili, A., Rahimi, J., 2018. Climate BT - The Soils of Iran, in: Roozitalab, M.H., Siadat, H., Farshad, A. (Eds.), . Springer International Publishing, Cham, pp. 19–33.
Koo, J., and Dimes, J. 2010. HC27 Generic Soil Profile Database. Version 1, July. International Food Policy Research Institute, Washington, DC.
Mesgaran, M., Madani, K., Hashemi, H., Azadi, P., 2016. Evaluation of land and precipitation for agriculture in Iran. Working paper #2, Iran 2040 Project, Stanford University.
Sinclair, T.R., 1986. Water and nitrogen limitations in soybean grain production: Model development. Field Crops Res. 15: 125-141.
Sinclair, T.R., de Wit, C.T., 1976. Analysis of the carbon and nitrogen limitations to soybean yield. Agron. J. 68, 319-324.
Soltani, A., Sinclair, T.R., 2011. A simple model for chickpea development, growth and yield. Field Crops Research 124 (2011) 252–260.
Soltani, A., Sinclair, T.R. 2012. Modeling Physiology of Crop Development, Growth and Yield. CABI publication. 322 p.
Soltani, A., Maddah, V., Sinclair, T.R., 2013. SSM-Wheat: a simulation model for wheat development, growth and yield. Int. J. Plant Prod. 7(4): 711-740.
van Bussel, L.G., Grassini, P., Van Wart, J., Wolf, J., Claessens, L., Yang, H., Boogaard,H., de Groot, H., Saito, K., Cassman, K.G., van Ittersum, M.K., 2015. From field toatlas: upscaling of location-specific yield gap estimates. Field Crop Res. 177,98–108.
van Wart, J., van Bussel, L. G. J., Wolf, J., Licker, R., Grassini, P., Nelson, A., Boogaard, H., Gerber, J., Mueller, N. D., Claessens, L., van Ittersum, M. K., and Cassman, K. G. 2013. Use of agro-climatic zones to upscale simulated crop yield potential. Field Crops. Res. 143:44-55.
 Appendix I. List of weather stations
|
NAME | #WMO | LAT | LONG | ELV | Real data | Genarated data |
| ABADAN | 40831 | 30.38 | 48.21 | 7 | 1999-2016 | |
| ABADEH | 40818 | 31.20 | 52.62 | 2030 | 1960-2016 | |
| ABALI | 40755 | 35.75 | 51.88 | 2465 | 1960-2016 | |
| AGHTOGHE | 37.90 | 55.63 | 250 | |||
| AHMADABAD (HYP) | 29.56 | 52.60 | 1488 | |||
| AHWAZ | 40811 | 31.34 | 48.74 | 23 | 1960-2016 | |
| ALIABAD | 99300 | 36.90 | 54.88 | 184 | 2004-2016 | 1999-2003 |
| ALIGOODARZ | 40783 | 33.41 | 49.70 | 2022 | 1986-2016 | |
| ALIGOODARZ (HYP) | 33.65 | 49.58 | 2000 | |||
| ARDABIL | 40708 | 38.22 | 48.33 | 1335 | 1976-2016 | |
| AVAJ | 99310 | 35.57 | 49.22 | 2035 | 1997-2016 | |
| BAM | 40854 | 29.10 | 58.35 | 1067 | 1960-2016 | |
| BANDARAMIRABAD | 99306 | 36.86 | 53.39 | -20 | 2004-2016 | 1999-2003 |
| BANDARANZALI | 40718 | 37.48 | 49.46 | -24 | 1960-2016 | |
| BANEH | 99280 | 36.01 | 45.90 | 1600 | 1960-2016 | |
| BAVANAT | 99561 | 30.48 | 53.61 | 2231 | 1960-2016 | |
| BEHBAHAN | 40834 | 30.61 | 50.22 | 313 | 1993-2016 | |
| BIARJAMAND | 40742 | 36.09 | 55.81 | 1099 | 1992-2016 | |
| BIJAR | 40748 | 35.89 | 47.62 | 1883 | 1987-2016 | |
| BILESOWAR | 99202 | 39.37 | 48.32 | 101 | 2004-2016 | 1999-2003 |
| BIRJAND | 40809 | 32.89 | 59.28 | 1491 | 1960-2016 | |
| BOROOJEN | 99459 | 31.98 | 51.30 | 2260 | 1988-2016 | |
| BOSHROOYEH | 99407 | 33.87 | 57.43 | 879 | 1988-2016 | |
| BOSTANABAD | 99248 | 37.85 | 46.84 | 1736 | 2006-2016 | 1999-2005 |
| BROUJERD | 40774 | 33.92 | 48.76 | 1629 | 1988-2016 | |
| CHAHCHAHEH (HYP) | 36.50 | 60.33 | 500 | |||
| DARAN | 40787 | 32.97 | 50.37 | 2290 | 1993-2016 | |
| DEHLORAN | 40796 | 32.68 | 47.28 | 232 | 1990-2016 | |
| DEZFUL (SAFIABAD) | 40794 | 32.25 | 48.43 | 83 | 1987-2016 | |
| DOGONBADAN | 40835 | 30.35 | 50.82 | 726 | 1985-2016 | |
| DORODZAN | 40844 | 30.21 | 52.42 | 1642 | 1988-2016 | |
| DOROUD | 99444 | 33.52 | 49.00 | 1522 | 2000-2016 | |
| EDAREGORGAN | 40738 | 36.91 | 54.41 | 0 | 1960-2016 | |
| EGHLIDEFARS | 40828 | 30.90 | 52.63 | 2300 | 1995-2016 | |
| ESLAMABADGHARB | 40779 | 34.12 | 46.47 | 1349 | 1988-2016 | |
| FARIMAN | 40825 | 35.65 | 59.83 | 1472 | 2008-2016 | 1999-2007 |
| GALANDROOD (HYP) | 36.45 | 53.90 | 1294 | |||
| GALIKESH-KALALEH (HYP) | 36.95 | 56.33 | 984 | |||
| GARMSAR | 40758 | 35.24 | 52.36 | 900 | 1986-2016 | |
| GERMI | 40714 | 39.05 | 48.06 | 749 | 2004-2016 | 1999-2003 |
| GHARAKHILGHAEMSHR | 40737 | 36.45 | 52.77 | 15 | 1984-2016 | |
| GHARGHABAD | 99412 | 35.11 | 49.83 | 1590 | 2006-2016 | 1999-2005 |
| GHAZVIN | 40731 | 36.26 | 50.06 | 1279 | 1960-2016 | |
| GHOM | 40770 | 34.77 | 50.86 | 879 | 1960-2016 | |
| GHOOCHAN | 40740 | 37.12 | 58.45 | 1287 | 1984-2016 | |
| GHORVEH | 40772 | 35.18 | 47.79 | 1906 | 1989-2016 | |
| GONBAD | 99240 | 37.27 | 55.21 | 37 | 1992-2016 | |
| HAJIABAD (SOUTH KHORASAN) (HYP) | 33.63 | 59.92 | 1447 | |||
| HAJIABAD HORMOZGAN | 40863 | 28.31 | 55.91 | 931 | 1998-2016 | |
| HAJIARAB (HYP) | 35.11 | 49.83 | 1590 | |||
| HAMEDAN (AIRPORT) | 40768 | 34.87 | 48.53 | 1741 | 1992-2016 | |
| HASANABADEDARAB | 40862 | 28.79 | 54.30 | 1098 | 1995-2016 | |
| HASHMABAD | 99241 | 36.85 | 54.27 | 13 | 1985-2015 | |
| HEZARKANIAN (HYP) | 35.75 | 46.80 | 1934 | |||
| ILAM | 40780 | 33.59 | 46.40 | 1337 | 1986-2016 | |
| IZEH | 99455 | 31.85 | 49.85 | 767 | 1993-2016 | |
| JAHROM | 99646 | 28.48 | 53.53 | 1082 | 2006-2016 | 1999-2005 |
| JAJARM | 99295 | 36.95 | 56.33 | 984 | 2005-2016 | 1999-2004 |
| KABOOTARABAD | 40803 | 32.52 | 51.83 | 1543 | 1987-2016 | |
| KAHNOUJ | 40877 | 27.99 | 57.71 | 499 | 1990-2016 | |
| KARAJ | 40752 | 35.81 | 50.95 | 1293 | 1985-2016 | |
| KAREHSANG (HYP) | 36.27 | 52.37 | 220 | |||
| KASHAN | 40785 | 33.97 | 51.48 | 955 | 1966-2016 | |
| KASHMAR | 40763 | 35.27 | 58.47 | 1110 | 1986-2016 | |
| KERMAN | 40841 | 30.26 | 56.96 | 1754 | 1960-2016 | |
| KERMANSHAH | 40766 | 34.35 | 47.15 | 1319 | 1960-2016 | |
| KHAF (HYP) | 34.58 | 60.15 | 998 | |||
| KHASH | 40870 | 28.23 | 61.19 | 1427 | 1986-2016 | |
| KHODABANDEH | 40733 | 36.14 | 48.59 | 1887 | 1994-2016 | |
| KHORRAMABAD | 40782 | 33.44 | 48.28 | 1148 | 1960-2016 | |
| KHORRAMDAREH | 40730 | 36.20 | 49.21 | 1575 | 1986-2016 | |
| KIASAR | 40760 | 36.25 | 53.55 | 1294 | 2002-2016 | 1999-2001 |
| KOMIJAN | 99432 | 34.71 | 49.31 | 1741 | 2005-2016 | 1999-2004 |
| KOOHDASHT | 99438 | 33.52 | 47.65 | 1198 | 1997-2016 | |
| KOOHRANG | 40797 | 32.46 | 50.13 | 2365 | 1987-2016 | |
| LALEHZAR | 40852 | 29.52 | 56.83 | 2775 | 2003-2016 | 2000-2002 |
| LAR | 40873 | 27.67 | 54.37 | 792 | 1989-2016 | |
| LORDEGAN | 40814 | 31.50 | 50.83 | 1611 | 1995-5016 | |
| LOUMAR | 99463 | 33.56 | 46.83 | 850 | 2008-2016 | 1999-2007 |
| MAHABAD | 40726 | 36.75 | 45.72 | 1352 | 1985-2016 | |
| MAHNESHAN | 40715 | 36.74 | 47.68 | 1285 | 2002-2016 | 1999-2001 |
| MANEVASAMALGHAN | 99262 | 37.51 | 56.86 | 890 | 2005-2016 | 1999-2004 |
| MARAGHEH | 40713 | 37.35 | 46.15 | 1344 | 1983-2016 | |
| MARAVETAPEH | 40721 | 37.80 | 55.94 | 460 | 1993-2016 | |
| MARVAST | 40840 | 30.40 | 54.20 | 1547 | 1997-2016 | |
| MASHHAD | 40745 | 36.24 | 59.63 | 999 | 1960-2016 | |
| MASJEDSOLEYMAN | 40812 | 31.98 | 49.24 | 321 | 1985-2016 | |
| MAZINAN (HYP) | 36.32 | 56.80 | 820 | |||
| MEIMEH (HYP) | 33.43 | 51.16 | 1980 | |||
| MESHKINSHAHR | 40705 | 38.38 | 47.68 | 1561 | 1995-2016 | |
| MIANDEHJIROFT | 40866 | 28.58 | 57.80 | 601 | 1989-2016 | |
| MIANEH | 40716 | 37.45 | 47.70 | 1110 | 1987-2016 | |
| MINODASHT | 99237 | 37.37 | 55.63 | 223 | 1985-2016 | |
| NAHAVAND | 99384 | 34.14 | 48.41 | 1678 | 1996-2016 | |
| OMIDIYEH (PAYGAH) | 40830 | 30.83 | 49.55 | 35 | 1993-2013 | 2014-2016 |
| OROMIYEH | 40712 | 37.66 | 45.06 | 1328 | 1960-2016 | |
| OSHNAVIEH | 99288 | 37.06 | 45.14 | 1416 | 2006-2016 | 1999-2005 |
| PARSABAD | 40700 | 39.60 | 47.78 | 73 | 1984-2016 | |
| PASHAKOLA (HYP) | 36.23 | 52.78 | 212 | |||
| PIRANSHAHR | 40724 | 36.70 | 45.15 | 1444 | 1986-2016 | |
| POLDOKHTAR | 40786 | 33.15 | 47.72 | 714 | 1998-2016 | |
| POLSEFID | 99360 | 36.13 | 53.08 | 610 | 2003-2016 | 1999-2003 |
| RAMSAR | 40732 | 36.90 | 50.68 | -20 | 1960-2016 | |
| RASHT | 40719 | 37.20 | 49.62 | 25 | 1960-2016 | |
| RAVANSAR | 40764 | 34.72 | 46.65 | 1380 | 1988-2016 | |
| ROSTAMROOD (HYP) | 36.58 | 52.10 | 0 | |||
| RUDAN | 99656 | 27.45 | 57.19 | 220 | 2003-2016 | 1999-2002 |
| SABZEVAR | 40743 | 36.21 | 57.65 | 962 | 1960-2016 | |
| SAGHEZ | 40727 | 36.22 | 46.31 | 1523 | 1961-2016 | |
| SARAKHS | 40741 | 36.54 | 61.15 | 278 | 1984-2016 | |
| SAREYN | 99231 | 38.15 | 48.08 | 1658 | 2003-2016 | 1999-2002 |
| SARGHANAT (HYP) | 29.47 | 51.27 | 95 | |||
| SARI | 40759 | 36.54 | 52.99 | 23 | 1999-2016 | |
| SARPOLZAHAB | 40765 | 34.45 | 45.87 | 545 | 1986-2016 | |
| SAVEH | 99372 | 35.08 | 50.37 | 1112 | 1993-2016 | |
| SHAHMIRZAD | 99386 | 35.77 | 53.35 | 1969 | 2010-2016 | 1999-2009 |
| SHAHREKORD | 40798 | 32.29 | 50.84 | 2049 | 1960-2016 | |
| SHAHREZA | 40815 | 31.98 | 51.81 | 1858 | 1993-2016 | |
| SHAHROUD | 40739 | 36.38 | 54.93 | 1325 | 1960-2016 | |
| SHAHROUD (HYP) | 36.38 | 54.93 | 1325 | |||
| SHIRAZ | 40848 | 29.56 | 52.60 | 1488 | 1960-2016 | |
| SHIRINABAD (HYP) | 36.72 | 55.02 | 1945 | |||
| SISAKHT (HYP) | 30.84 | 51.47 | 2133 | |||
| SONGHOR | 99429 | 34.78 | 47.58 | 1700 | 2006-2016 | 1999-2005 |
| TABRIZ | 40706 | 38.12 | 46.24 | 1361 | 1960-2016 | |
| TAKAB | 40728 | 36.40 | 47.10 | 1817 | 1985-2016 | |
| TAKHTEJAMSHEID | 99575 | 29.92 | 52.89 | 1605 | 2003-2016 | 1999-2002 |
| TALESH | 99249 | 37.84 | 48.90 | 7 | ||
| TALKHBAKHSH (HYP) | 35.72 | 58.87 | 1310 | |||
| TORBATE JAM | 40806 | 35.29 | 60.56 | 950 | 1993-2016 | |
| YASOUJ | 40836 | 30.70 | 51.56 | 1816 | 1987-2016 | |
| ZABOL | 40829 | 31.09 | 61.54 | 489 | 1980-2016 | |
| ZARGHAN | 40847 | 29.78 | 52.70 | 1596 | 1989-2016 | |
 Appendix II. Model testing results
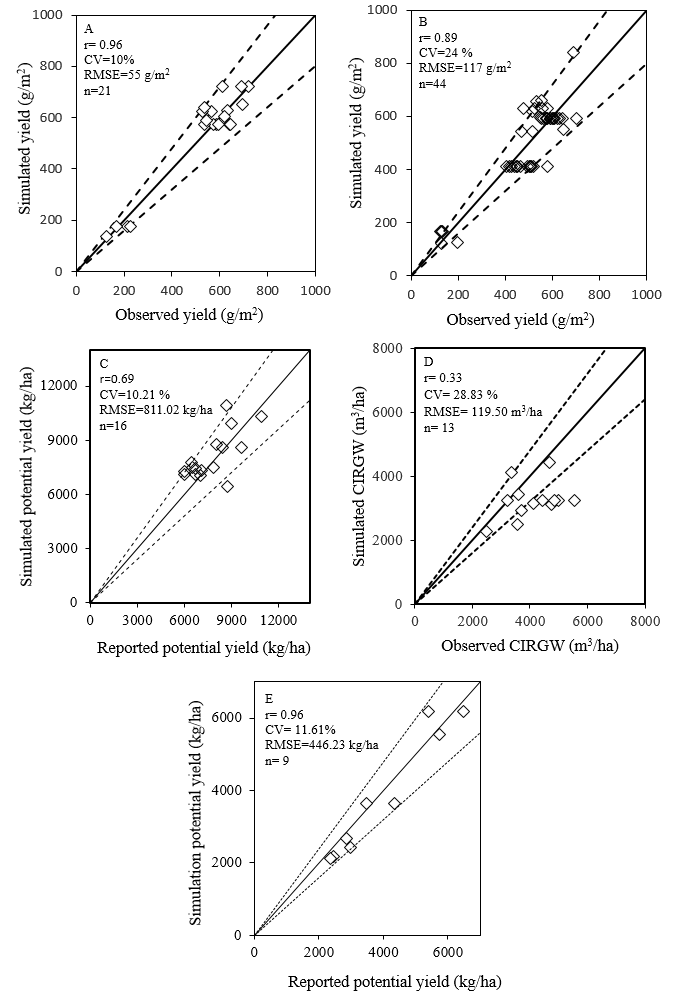
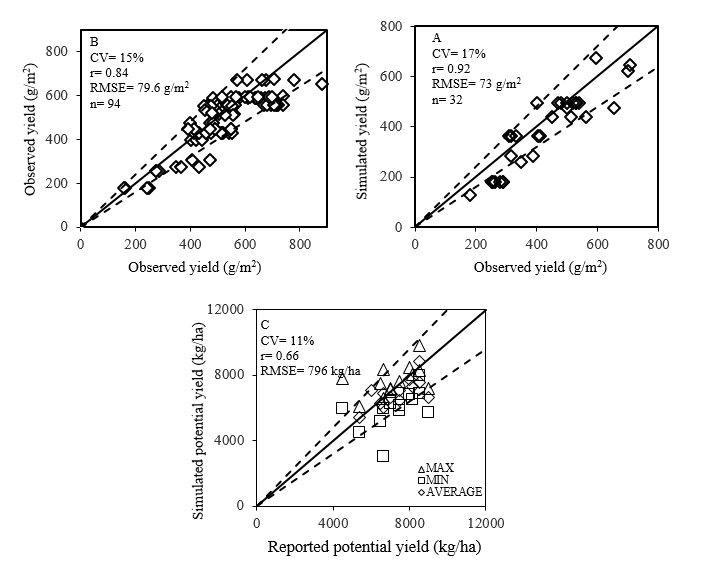
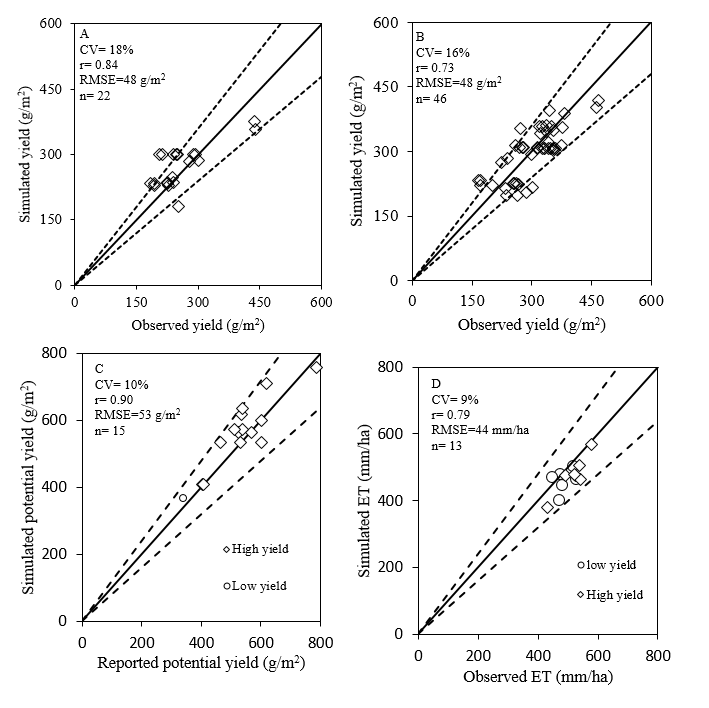
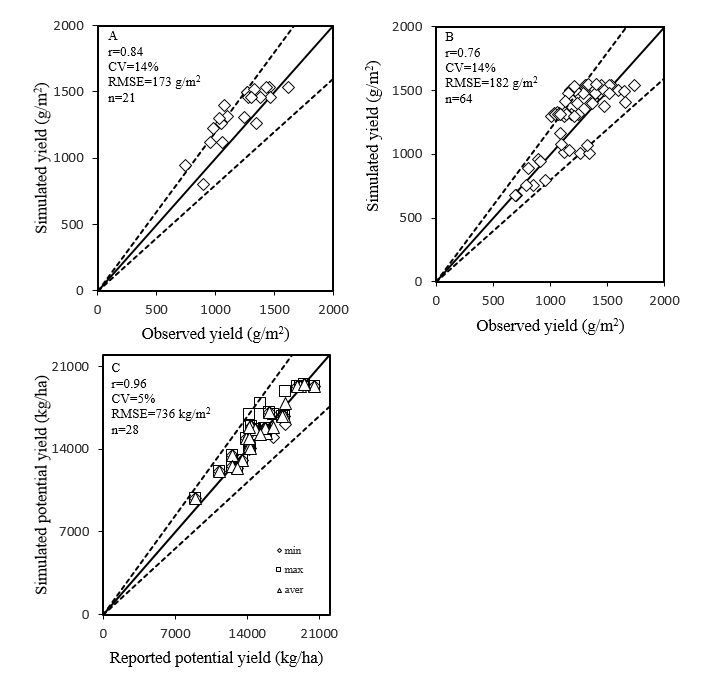
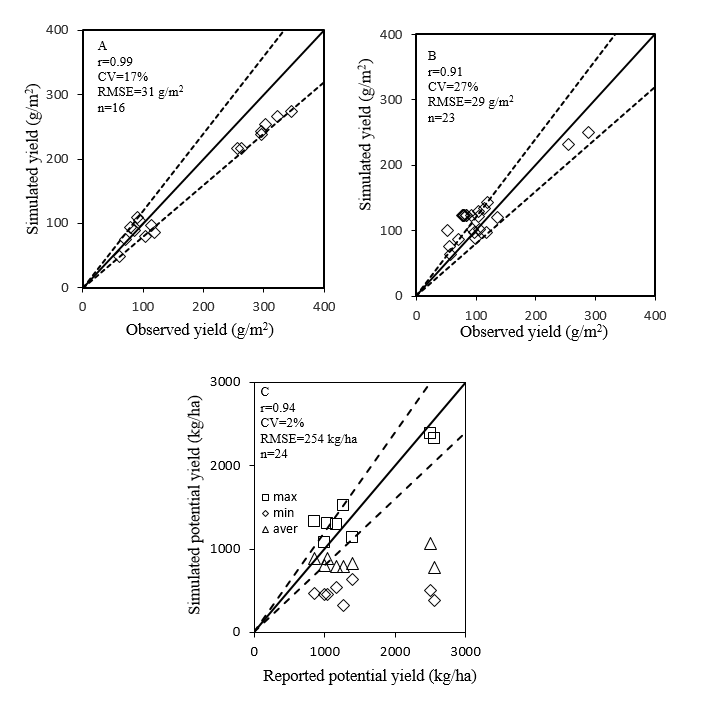
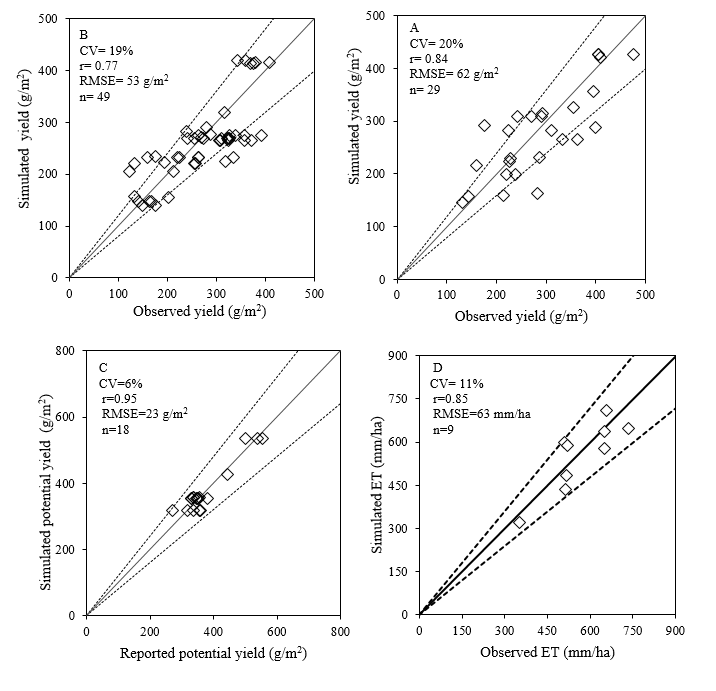
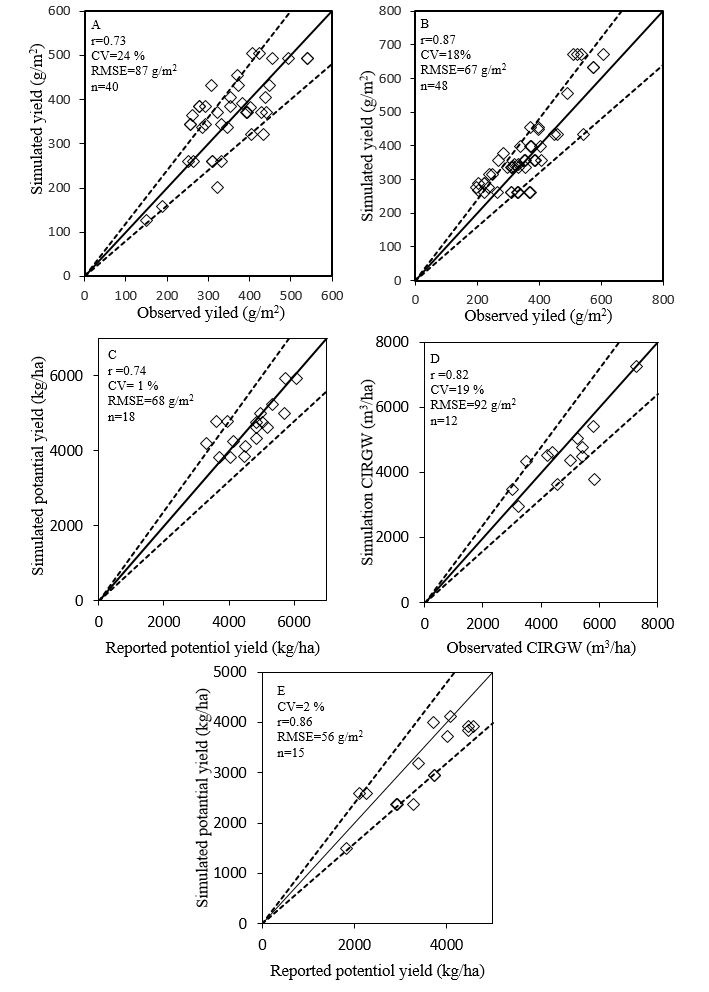
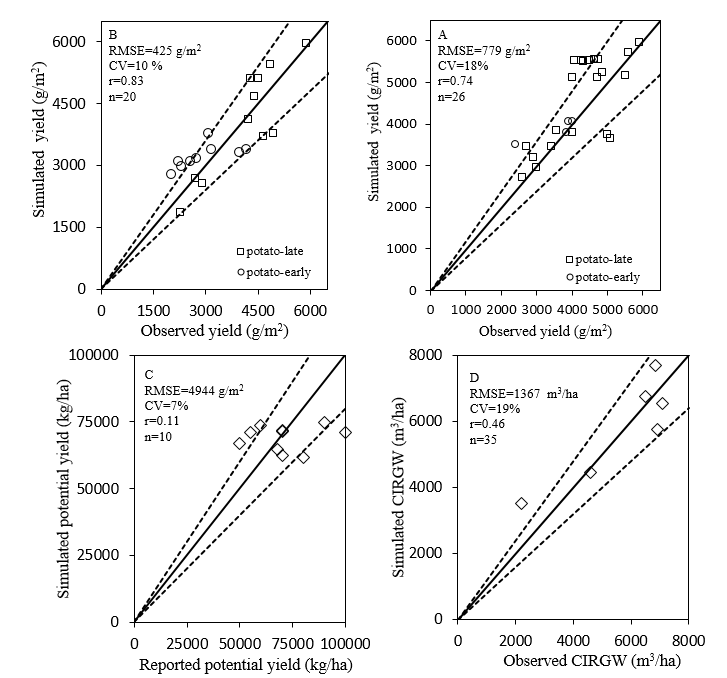
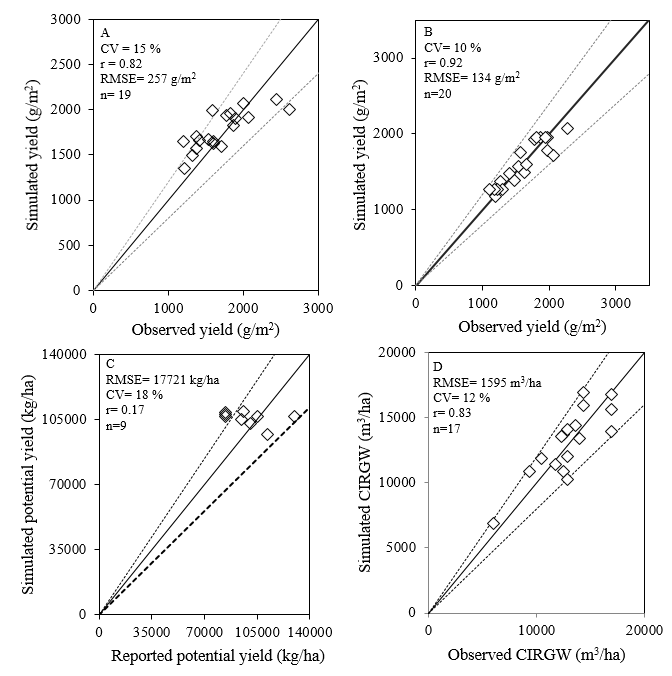
It should be noted that data used in (A) and (B) panels are from different experimental treatments under both rainfed and irrigated conditions of main producing areas of that crop in Iran and are not necessary potential yield.
Wheat:
Simulated versus observed yields from data used in model parameterization (A) and evaluation (B), simulated potential yield versus reported irrigated potential yield (C), simulated versus observed cumulative irrigation water or evapotranspiration (D) and simulated potential yield versus reported rainfed potential yield.
Barley:
Simulated versus observed yields from data used in model parameterization (A) and evaluation (B), simulated potential yield versus reported potential yield (C). In (C), potential yields reported for different locations are compared with minimum, average and maximum potential yield for the same locations over 15 years.
Rice:
Simulated versus observed yields from data used in model parameterization (A) and evaluation (B), simulated potential yield versus reported irrigated potential yield (C), simulated versus observed cumulative irrigation water (D).
High yield: new high yield cultivars
Low yield: local low yield cultivars
Maize:
Simulated versus observed yields from data used in model parameterization (A) and evaluation (B), and simulated potential yield versus reported irrigated potential yield (C). In (C), potential yields reported for different locations are compared with minimum, average and maximum potential yield for the same locations over 15 years.
Chickpea:
Simulated versus observed yields from data used in model parameterization (A) and evaluation (B), simulated potential yield versus reported rainfed potential yield (C). In (C), potential yields reported for different locations are compared with minimum, average and maximum potential yield for the same locations over 15 years.
Common bean:
Simulated versus observed yields from data used in model parameterization (A) and evaluation (B), simulated potential yield versus reported potential yield (C), simulated versus observed cumulative evapotranspiration (D).
Soybean:
Simulated versus observed yields from data used in model parameterization (A) and evaluation (B), simulated potential yield versus reported potential yield (C), simulated versus observed cumulative irrigation water (D). In (C), potential yields reported for three locations are compared with minimum, average and maximum potential yield for the same locations over 10 years.

Cotton:
Simulated versus observed yields from data used in model parameterization (A) and evaluation (B), simulated potential yield versus reported potential yield (C), and simulated versus observed cumulative irrigation water or evapotranspiration (D). In (C), potential yields reported for different locations are compared with minimum, average and maximum potential yield for the same locations over 14 years.

Rapeseed:
Simulated versus observed yields from data used in model parameterization (A) and evaluation (B), simulated potential yield versus reported irrigated potential yield (C), simulated versus observed cumulative irrigation water (D) and simulated potential yield versus reported rainfed potential yield (E).
Potato:
Simulated versus observed yields from data used in model parameterization (A) and evaluation (B), simulated potential yield versus reported irrigated potential yield (C), and simulated versus observed cumulative irrigation water (D).
Sugar beet:
Simulated versus observed yields from data used in model parameterization (A) and evaluation (B), simulated potential yield versus reported irrigated potential yield (C), and simulated versus observed cumulative irrigation water (D).
Get access to the Atlas for advanced users
Download GYGA results
 | Please read the license information in case you are interested in using the data from the Global Yield Gap Atlas. |
| read more>> |
 Country agronomists

