 Appendix II. Model testing results
It should be noted that data used in (A) and (B) panels are from different experimental treatments under both rainfed and irrigated conditions of main producing areas of that crop in Iran and are not necessary potential yield.
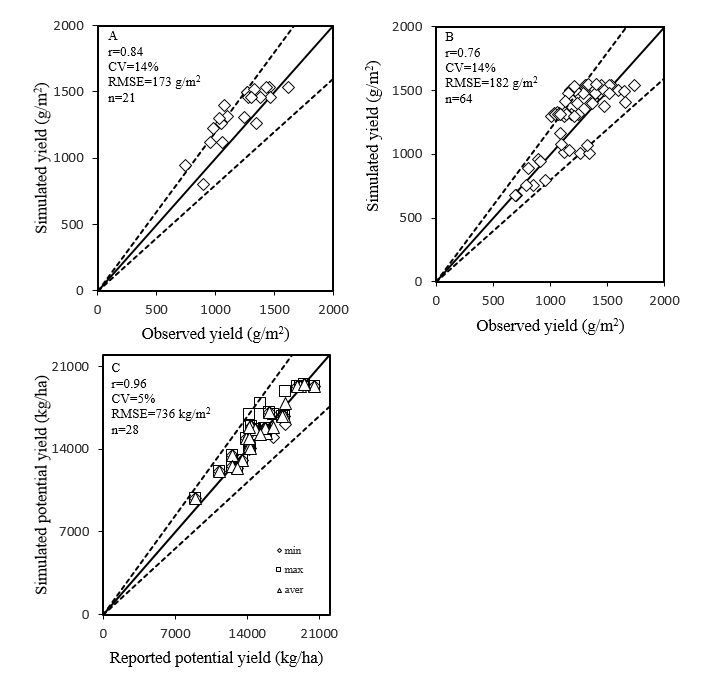
Wheat:
Simulated versus observed yields from data used in model parameterization (A) and evaluation (B), simulated potential yield versus reported irrigated potential yield (C), simulated versus observed cumulative irrigation water or evapotranspiration (D) and simulated potential yield versus reported rainfed potential yield.
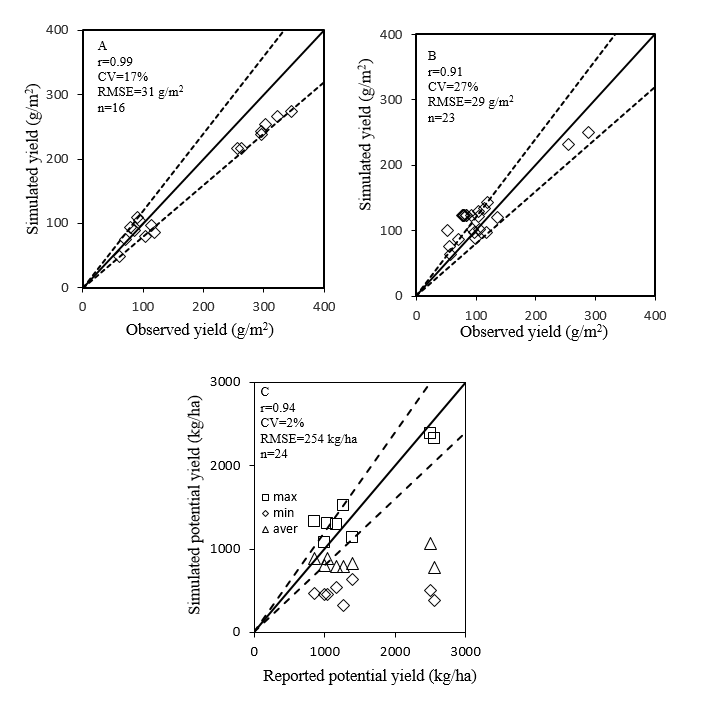
Barley:
Simulated versus observed yields from data used in model parameterization (A) and evaluation (B), simulated potential yield versus reported potential yield (C). In (C), potential yields reported for different locations are compared with minimum, average and maximum potential yield for the same locations over 15 years.
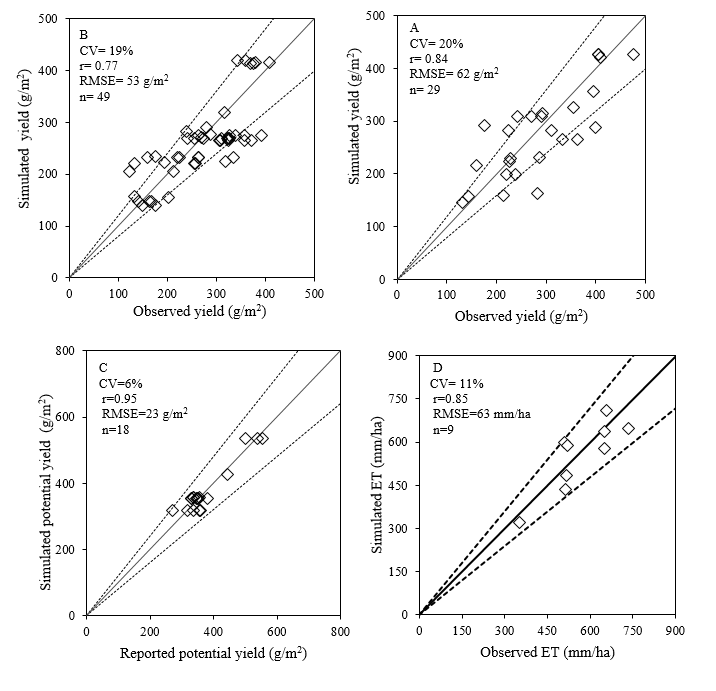
Rice:
Simulated versus observed yields from data used in model parameterization (A) and evaluation (B), simulated potential yield versus reported irrigated potential yield (C), simulated versus observed cumulative irrigation water (D).
High yield: new high yield cultivars
Low yield: local low yield cultivars
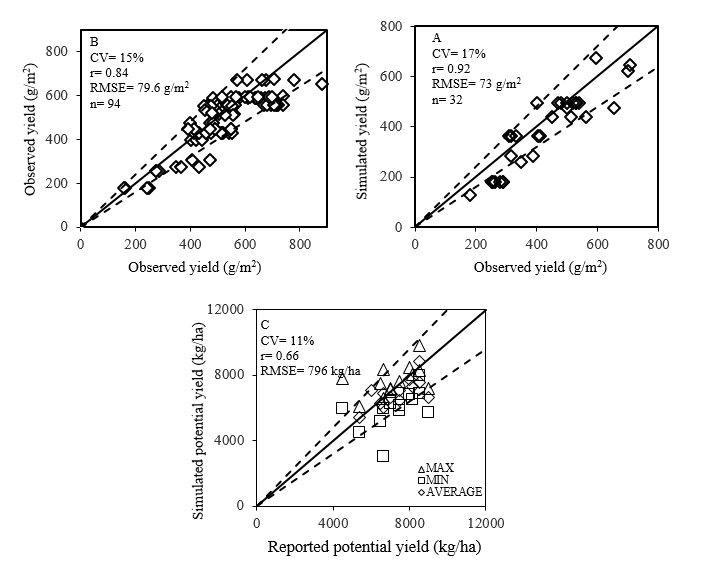
Maize:
Simulated versus observed yields from data used in model parameterization (A) and evaluation (B), and simulated potential yield versus reported irrigated potential yield (C). In (C), potential yields reported for different locations are compared with minimum, average and maximum potential yield for the same locations over 15 years.
Chickpea:
Simulated versus observed yields from data used in model parameterization (A) and evaluation (B), simulated potential yield versus reported rainfed potential yield (C). In (C), potential yields reported for different locations are compared with minimum, average and maximum potential yield for the same locations over 15 years.
Common bean:
Simulated versus observed yields from data used in model parameterization (A) and evaluation (B), simulated potential yield versus reported potential yield (C), simulated versus observed cumulative evapotranspiration (D).
Soybean:
Simulated versus observed yields from data used in model parameterization (A) and evaluation (B), simulated potential yield versus reported potential yield (C), simulated versus observed cumulative irrigation water (D). In (C), potential yields reported for three locations are compared with minimum, average and maximum potential yield for the same locations over 10 years.

Cotton:
Simulated versus observed yields from data used in model parameterization (A) and evaluation (B), simulated potential yield versus reported potential yield (C), and simulated versus observed cumulative irrigation water or evapotranspiration (D). In (C), potential yields reported for different locations are compared with minimum, average and maximum potential yield for the same locations over 14 years.

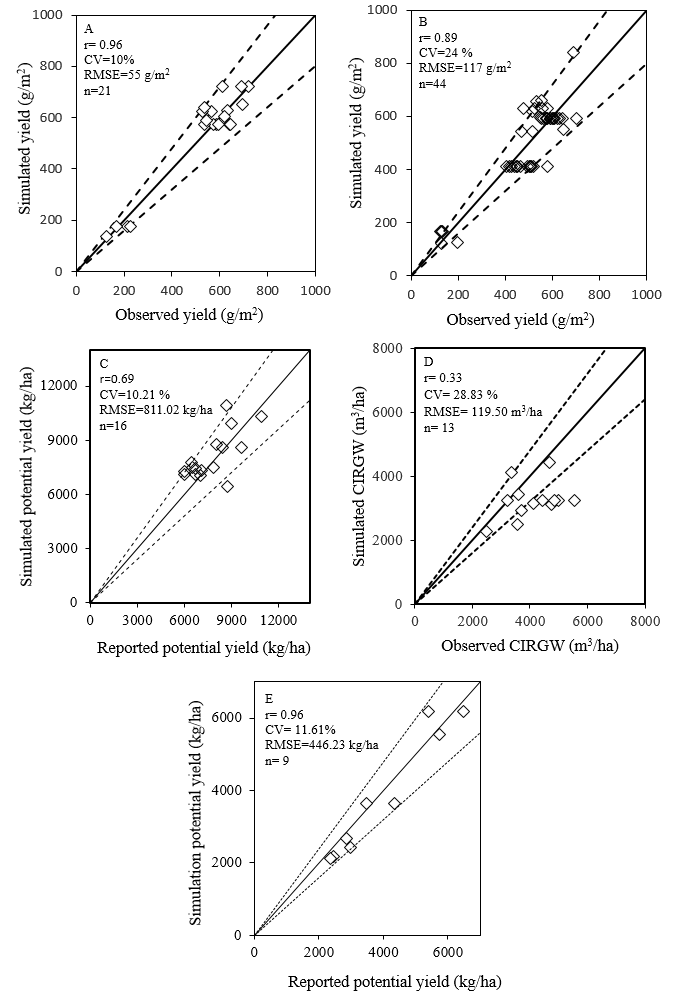
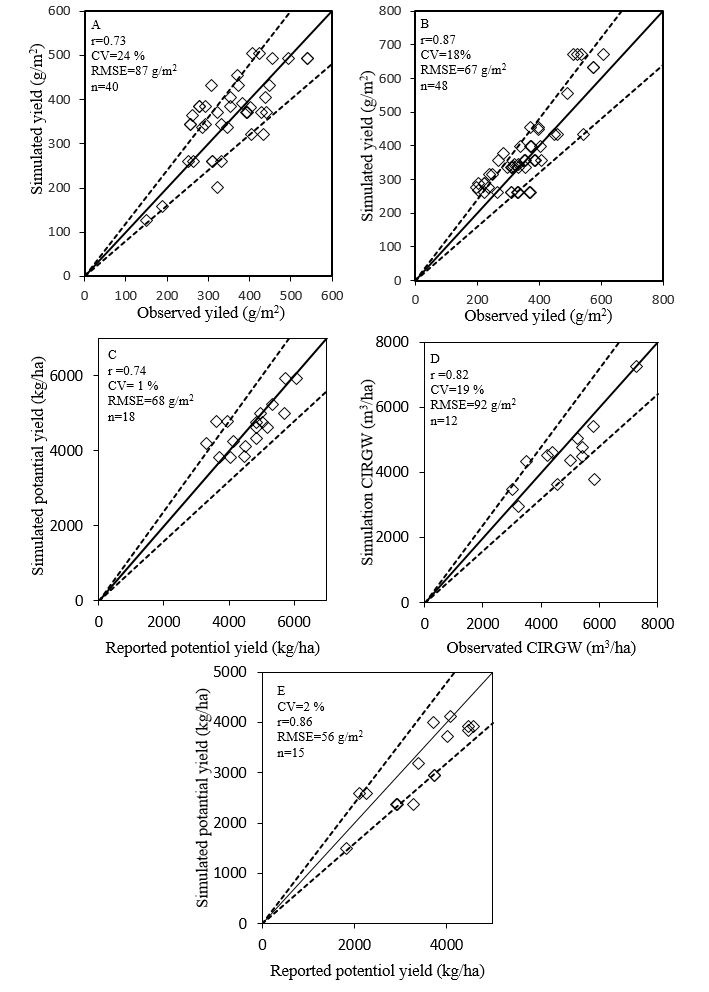
Rapeseed:
Simulated versus observed yields from data used in model parameterization (A) and evaluation (B), simulated potential yield versus reported irrigated potential yield (C), simulated versus observed cumulative irrigation water (D) and simulated potential yield versus reported rainfed potential yield (E).
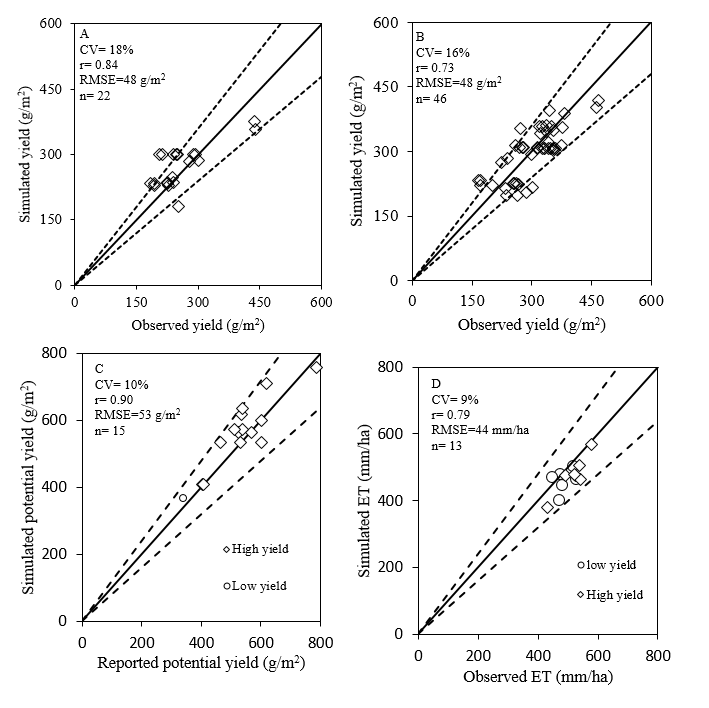
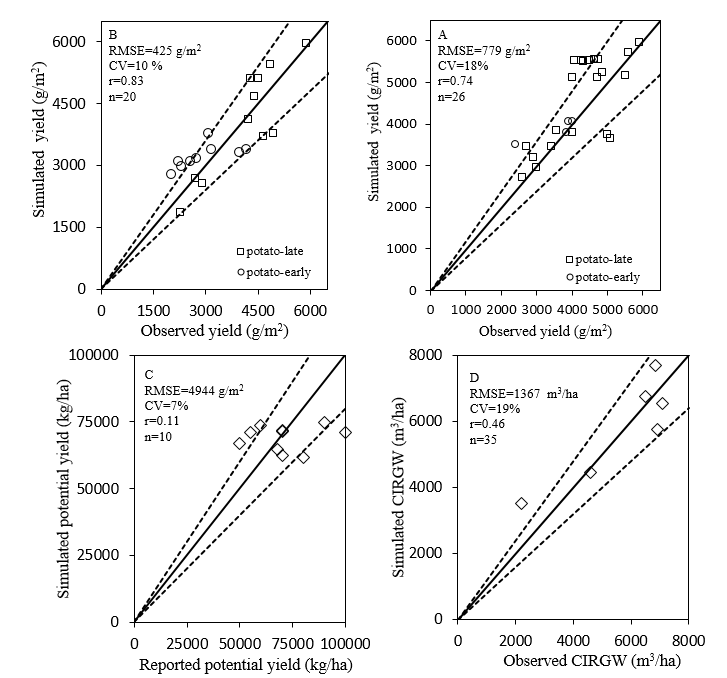
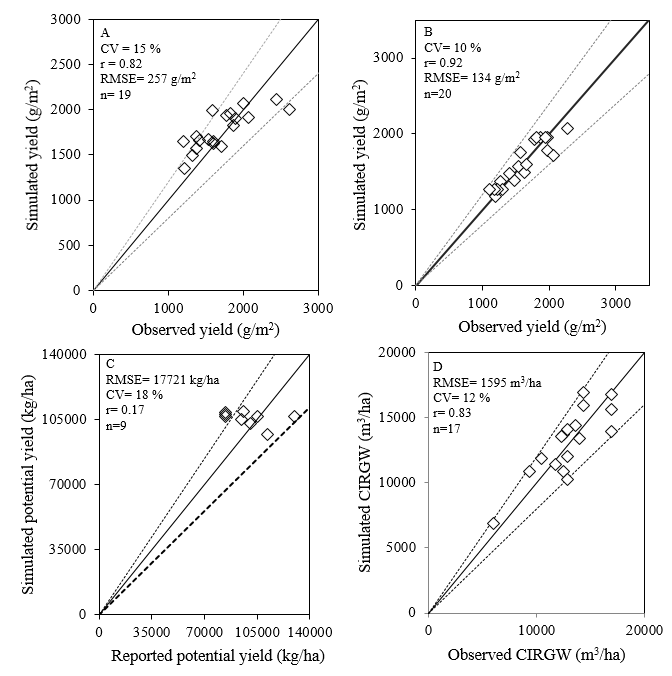
Potato:
Simulated versus observed yields from data used in model parameterization (A) and evaluation (B), simulated potential yield versus reported irrigated potential yield (C), and simulated versus observed cumulative irrigation water (D).
Sugar beet:
Simulated versus observed yields from data used in model parameterization (A) and evaluation (B), simulated potential yield versus reported irrigated potential yield (C), and simulated versus observed cumulative irrigation water (D).

Get access to the Atlas for advanced users
Download GYGA results
| Please read the license information in case you are interested in using the data from the Global Yield Gap Atlas. | |
| read more>> |
Country agronomists