
 Mexico
Maize in Mexico
Maize and Mexico are deeply connected. Maize is Mexico’s main staple crop, and Mexico is the center of origin, domestication, and diversity of maize (Yang et al., 2023). Direct maize consumption provides 30% of protein and 40% of energy intake in Mexican diets, making Mexicans the largest direct maize consumers in the world (ca. 350 kg of maize per capita). Maize production area in Mexico has remained stable since 1980, including about 7 million hectares, while average yields have steadily risen from about 2.5 t/ha in 2000 to 3.9 t/ha in 2020 (SIAP, 2024). This increase was largely driven by an increase in irrigated average yield from 6 to 8.8 t/ha. In contrast, rainfed average yield has marginally increased in the last 20 years from 2 to 2.5 t/ha (SIAP, 2024). Altogether, Mexico currently produces 27.4 million tons of maize annually, of which 86% is white corn, mostly used for human consumption, while the rest is yellow corn mostly used for animal feed. In addition, Mexico imports 16 million tons of maize (mostly yellow), which comes US and Brazil (FAOSTAT, 2023; Gobierno de México, 2024).
Mexico sustains a large diversity of maize agroecological regions, including highlands, tropical humid lowlands, and temperate environments. Most irrigated maize area is sown with hybrid maize, mostly located in the northern Pacific region (Sinaloa and Sonora), the mid-elevation region (Guanajuato, Michoacán, and Jalisco), the north-central (Chihuahua), and northeastern region (Tamaulipas). The rainfed maize area is spread across the central and southern parts of the country. Main rainfed maize producing areas include the southern region (e.g., Veracruz, Chiapas, Yucatan) where tropical varieties are sown, the “central Valleys” region where cultivars adapted to highland environments are grown, and the mid-elevation region (Guanajuato and Jalisco).
A large portion of the rainfed area is sown with native varieties (referred to as “criollos”), which account for 54% of all the total (irrigated + rainfed) area sown with maize in Mexico. These local varieties yield around 1 to 2 t/ha (Govaerts et al., 2019). For our assessment of yield potential and yield gaps, we only considered the area sown with hybrid maize.
Wheat in Mexico
Wheat production area in Mexico occupies about 700,000 hectares, a figure that has been stable since mid-1990s, where 3.8 million t of grains are produced annually. In the post-green revolution period, wheat yields in Mexico fluctuated around 4 t/ha for much of the 1980s before rising and stabilizing around 5.2 t/ha by mid-2000s. Even with this yield gain, net imports of wheat more than tripled from about 0.8 Mt in 1980 to 3.5 Mt in recent years (FAOSTAT, 2019).
About 88% of total wheat area in Mexico is under irrigation, where average yield is 5.6 t/ha at national level (http://infosiap.siap.gob.mx). The most important area for irrigated wheat is located in the Northwest region (Baja California, Sonora, and Sinaloa states), while other relevant areas for this crop can be found in the Northeast (Nuevo Leon state) and in El Bajio region in the central states of Mexico (Guanajuato, Queretaro, Michoacán, and Jalisco). Wheat crop systems in Mexico include one crop cycle per year, in the northwestern part of the country, which usually goes from November-December to March-April, but also as a rotation with sorghum or maize in El Bajio region. In Baja California and Sonora states, durum wheat is the most typical type, whereas the rest of the country mostly cultivate soft wheat varieties.
Data sources and assumptions (following GYGA protocols)
Weather data and reference weather stations
Based on crop harvested area distribution (SPAM, 2005 for wheat and SPAM 2010 for maize) and the agro-climatic zones defined for Mexico (Van Wart et al., 2013), a total of 11, 9, and 17 reference weather stations (RWS) were selected for irrigated wheat, irrigated maize, and rainfed maize, respectively. RWS buffer zones accounted for 70% (irrigated wheat), 43% (irrigated maize), and 24% (rainfed maize) of total harvested area, while the agro-climatic zones where these RWS were located accounted for 81%, 56%, and 47% of national area for each crop.
For maize, SMN-CONAGUA weather stations (https://smn.conagua.gob.mx/es/) were used to retrieve daily weather data between 2000 and 2021 for maximum and minimum temperature and precipitation. For wheat, CLICOM meteorological stations network (Climate Computing project; http://clicom-mex.cicese.mx) was used to retrieve daily temperature weather data for 15+ years. NASA-POWER (http://power.larc.nasa.gov/) was used as source of incident solar radiation data at all RWS because daily measured solar radiation was lacking. Quality control and filling/correction of the weather data was performed based on correlations between the target RWS and two adjacent weather stations following van Wart et al. (2013). Number of corrections/filled data was always lower than 3%. Complete weather records were available for the 1998-2012 interval for irrigated wheat, and for 2000-2021 for irrigated and rainfed maize.
Soil data
For rainfed maize, we used the open database Edafología Serie II of Mexico (2013) to identify the most dominant soil within each buffer. We overlayed this spatial data with maize area distribution data (SPAM 2010) to estimate the fraction of maize area in each soil type and select the three most dominant soil types of each buffer. All selected soil types were validated with local agronomists and visually with high resolution Earth Observation products to ensure they are representative of cultivated lands. We used the soil texture information associated with each soil type to estimate their plant available water holding capacity. To accomplish this, we used the equations derived by Hodnett and Tomasella (2002) for tropical soils (southern region) and the ones derived by Ritchie and Crum (1988) and revised by Gijsman et al. (2003) for temperate soils (mid-elevation and highlands). We set a maximum soil depth of 0.85 m for tropical soils and 1.5 for temperate soils.
Management data
Management practices for each RWS buffer zone were retrieved from local agronomists. Requested information included average and optimal planting dates, dominant cultivar names and crop cycle length, and actual and optimal plant population density. The provided data were subsequently corroborated by other local and national experts.
Crop modeling
For wheat, simulations of widespread varieties for each region were performed using CERES-wheat model embedded in DSSAT v 4.6.1.0 (Jones et al., 2003). Genetic coefficients were derived and validated for this analysis based on data from 32 well-managed irrigated experiments located in Ciudad Obregon (Sonora), Mexicali (Baja California), General Teran (Nueva Leon), La Barca (Jalisco) and Los Mochis (Sinaloa). Crop phenology was calibrated for three different cultivars types: CIRNO C 2008 (durum wheat), an intermediate cycle soft-wheat, and a short cycle soft-wheat (RMSE emergence-anthesis and emergence-maturity= 4-7 days). Many of these experiments may have experienced nutrient and water deficiencies, incidence of biotic adversities, and other yield-reducing factors. Therefore, genetic coefficients were adjusted to address highest yields obtained at each experimental site. A durum wheat variety (CIRNO C 2008) was simulated for buffers located in Sonora and Baja California states. An intermediate soft wheat variety was simulated in Sinaloa and Nuevo Leon states. Finally, the average of short and intermediate wheat varieties was used in the remaining central states of Mexico.
For maize, we used CERES-maize embedded in DSSAT v4.7 (Jones et al., 2003) to simulate the most dominant hybrid in each region. To calibrate the genetic coefficients, we used measured data collected in variety trials conducted across the country by private sector companies. In the case of highland maize hybrids, we adjusted the model optimum temperature for vegetative and reproductive development to account for its adaptation to cool environments using data from Ellis et al. (1992). Similarly to wheat, genetic yield coefficients were adjusted to mirror the highest yields of each site to account for uncontrolled yield limiting or reducing factors. Model performance for all hybrids was validated against an independent dataset of field trials data. All field trial data was provided by a seed company.
In the case of wheat, we simulated the yield potential without water limitations as most of the rainfed wheat production is irrigated and the yield gap was calculated as the difference between yield potential and average irrigated wheat yield. In the case of maize, we simulated yield potential for irrigated maize whereas the water-limited yield potential (Yw) was simulated for rainfed maize and used as benchmarks for calculating their respective yield gaps.
Harvest area and actual yields
Water regime specific district-level data on crop harvested area and average yields for each crop were retrieved from official national statistics (SIAP, 2024). Weighted average actual yields were calculated for each buffer-year based on their harvested area during the period 2010-2015 (wheat) and 2010-2020 (maize). For wheat, year 2013 was discarded from the analysis due to extremely low yields in extended areas. Given that SIAP statistics do not discern between fields sown with hybrid seed or native varieties, actual yields for rainfed hybrid maize were estimated by accounting for the fraction of maize area sown with native varieties and their yield, based on the site-specific native variety areas and yields reported by CIMMYT (Govaerts et al., 2019). Hence, average actual yields for rainfed hybrid maize were estimated as:
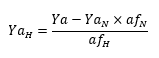
Where YaH and YaN are the actual yield of hybrid and native maize, respectively, whereas afn and afH are their area fraction.
References
Edafología Serie II de México, INEGI, 2013. URL https://idegeo.centrogeo.org.mx/layers/geonode%3Aedafologia_2013_gw84 (last accessed 4.17.24)
Ellis, R.H., Summerfield, R.J., Edmeades, G.O., Roberts, E.H., 1992. Photoperiod, Temperature, and the Interval from Sowing to Tassel Initiation in Diverse Cultivars of Maize. Crop Science 32 https://doi.org/10.2135/cropsci1992.0011183X003200050033x
FAOSTAT, 2023. Food and Agriculture Organization of the United Nations. FAO, Rome.
Gijsman, A.J., Jagtap, S.S., Jones, J.W., 2003. Wading through a swamp of complete confusion: how to choose a method for estimating soil water retention parameters for crop models. European Journal of Agronomy 18, 77–106.
Gobierno de México, 2024. Maíz: Intercambio comercial, compras y ventas internacionales, mercado y especialización [WWW Document]. Data México. URL https://www.economia.gob.mx/datamexico/es/profile/product/corn (last accessed 4.17.24).
Govaerts, B., Chávez, X., Fernández, A., Vega Lira, D., Vázquez, O., Pérez, M., Carvajal, A., Ortega, P., López, P., Rodríguez, R., Kruseman, G., Donnet, M.L., Palacios-Rojas, N., Verhulst, N., Gardeazabal Monsalue, A., González, G., Sánchez, K.C., Rosado, L.G., 2019. Maíz para México - Plan Estratégico 2030. CIMMYT.
Hodnett, M.G., Tomasella, J., 2002. Marked differences between van Genuchten soil water-retention parameters for temperate and tropical soils: a new water-retention pedo-transfer functions developed for tropical soils. Geoderma 108, 155–180. https://doi.org/10.1016/S0016-7061(02)00105-2
Hoogenboom, G., J.W. Jones, P.W. Wilkens, C.H. Porter, K.J. Boote, L.A. Hunt, U. Singh, J.I. Lizaso, J.W. White, O. Uryasev, R. Ogoshi, J. Koo, V. Shelia, and G.Y. Tsuji. 2015. Decision Support System for Agrotechnology Transfer (DSSAT) Version 4.6 (www.DSSAT.net). DSSAT Foundation, Prosser, Washington.
Jones, J.W., G. Hoogenboom, C.H. Porter, K.J. Boote, W.D. Batchelor, L.A. Hunt, P.W. Wilkens, U. Singh, A.J. Gijsman, and J.T. Ritchie. 2003. DSSAT Cropping System Model. European Journal of Agronomy 18:235‐265.
Ritchie, J.T., Crum, J., 1988. Converting soil survey characterization data into IBSNAT crop model input, in: Bouma, J., Bregt, A.K. (Eds.), Land Qualities in Space and Time. Proceedings of a Symposium Organized by the International Society of Soil Science (ISSS). Pudoc, Wageningen, Wageningen, the Netherlands, pp. 155–167.
SIAP, S. de I.A. y P., 2024. Datos Abiertos - Estadística de Producción Agrícola. URL http://infosiap.siap.gob.mx/gobmx/datosAbiertos.php
Van Wart, J., Van Bussel, L.G.J., Wolf, J., Licker, R., Grassini, P., Nelson, A., Boogaard, H., Gerber, J., Mueller, N.D., Claessens, L., Cassman, K.G., Van Ittersum, M.K., 2013a. Reviewing the use of agro-climatic zones to upscale simulated crop yield potential. Field Crops Res. 143, 44-55.
Yang, N., Wang, Y., Liu, X., Jin, M., Vallebueno-Estrada, M., Calfee, E., Chen, L., Dilkes, B.P., Gui, S., Fan, X., Harper, T.K., Kennett, D.J., Li, W., Lu, Y., Ding, J., Chen, Z., Luo, J., Mambakkam, S., Menon, M., Snodgrass, S., Veller, C., Wu, Shenshen, Wu, Siying, Zhuo, L., Xiao, Y., Yang, X., Stitzer, M.C., Runcie, D., Yan, J., Ross-Ibarra, J., 2023. Two teosintes made modern maize. Science 382, eadg8940. https://doi.org/10.1126/science.adg8940

Get access to the Atlas for advanced users
Download GYGA results
| Please read the license information in case you are interested in using the data from the Global Yield Gap Atlas. | |
| read more>> |
Country agronomists

Ivan Ortiz-Monasterio

Eduardo Villasenor